0

Consider the following short example of transformations.

Let the joint density of X and Y be given by the unit square, i.e.

$$f_{X,Y}(x,y) = \begin{cases} 1\ \quad 0<x<1\ \text{ and }\ 0<y<1 \\ 0 \quad \text{elsewhere} \end{cases}$$

Then the Cumulative Distribution Function of $Z=X+Y$ is given by:

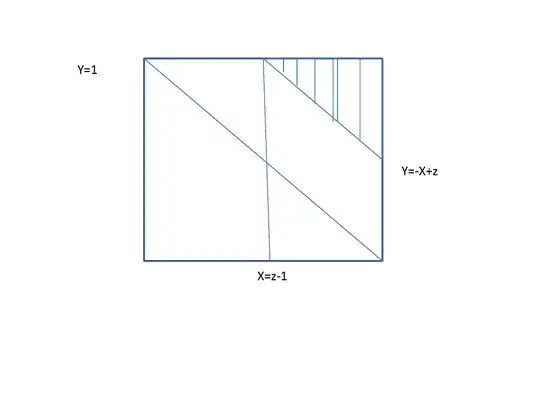
$$ F_Z = \begin{cases}\begin{array}{ll} 0\ & \text{ for }\ z<0 \\ \int_0^{z} \int_0^{z-x} dy\,dx\ & \text{ for }\ 0\leq z <1 \\1-\int_{z-1}^1 \int_{z-x}^1 dy\,dx\ & \text{ for }\ 1\leq z<2 \\1\ & \text{ for }\ 2\leq{z} \end{array}\end{cases} $$

I understand why we have to partition our CDF, what I am having trouble figuring out is why for the interval $[1,2)$ that specific form. What is the intuition here? Thanks.

Glen_b
  • 257,508
  • 32
  • 553
  • 939
JohnK
  • 18,298
  • 10
  • 60
  • 103
  • Hint: Always in these type of problems, draw a diagram, here a unit square ( i.e. $0 – Stat Oct 12 '13 at 17:14
  • I forgot to add that sometimes it is easier to calculate the area above your line and then subtract it from 1. It means that instead of finding $P(Z\leq z)$, you will find $P(Z>z)$ and then $P(Z\leq z)=1-P(Z>z)$. – Stat Oct 12 '13 at 17:24
  • I have drawn a figure and while I understand what I need to do, I still cannot explain the lower limit of integration of x, that is z-1. – JohnK Oct 12 '13 at 17:39
  • 2
    A few of the ways one might go about computing the distribution of a sum of uniform variates are described in my answer at http://stats.stackexchange.com/a/43075/919. That question might even be a duplicate of this one, depending on what you mean by "that specific form." What do you mean? – whuber Oct 12 '13 at 22:32

1 Answers1

2

OK, check out the following plot. enter image description here

You need to find the area of shaded region. So you need to take double integration over the shaded region. First you fix your $X$ and take your integration with respect to $Y$. Look at the double bar in the middle of that triangle (upper right corner). Its lower part goes from $Y=-X+z$ to its upper part $Y=1$. These are the bounds for the first integration. Now you need to move that little bar in the middle to left and right to cover all the shaded region. In other words, it means that this time, you need to take your integration with respect to $X$. So as you can see, the line $Y=-X+z$ for $1\leq z<2$ intercepts the line $Y=1$ at $X=z-1$. This is the left boundary limit for your integration. Now move that little bar to the right, it should go up to $X=1$, that gives you the upper bound. Hope that helps.

Stat
  • 7,078
  • 1
  • 24
  • 49