I have a survey app (programmed using Ruby On Rails), and I am required to cluster the responses.
I am using a Ruby library called AI4R and my code (in the event it is useful...) looks like the below (example code filched from AI4R)
# 5 Questions on a post training survey
questions = [   "The material covered was appropriate for someone with my level of knowledge of the subject.",
                "The material was presented in a clear and logical fashion",
                "There was sufficient time in the session to cover the material that was presented",
                "The instructor was respectful of students",
                "The instructor provided good examples"]

# Answers to each question go from 1 (bad) to 5 (excellent)
# The answers array has an element per survey complemented.
# Each survey completed is in turn an array with the answer of each question.
answers = [
            [ 1, 2, 3, 2, 2],   # Answers of person 1
            [ 5, 5, 3, 2, 2],   # Answers of person 2
          ]

data_set = DataSet.new(:data_items => answers, :data_labels => questions)

# Let's group answers in 4 groups
clusterer = Diana.new.build(data_set, 4)
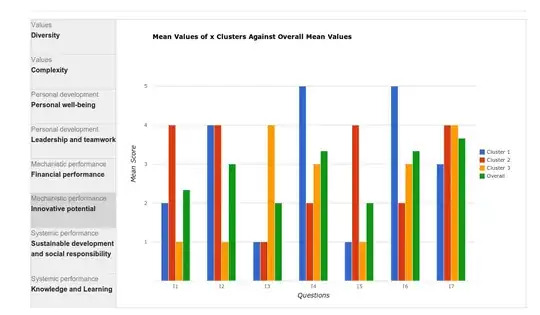
This in turn lets me create graphs like this (the survey has questions which are linked to themes/axes).
The problem is that right now you have to pick (read guess) the number of clusters to pass into AI4R.
I saw on Wikipedia that there is a technique called the Elbow Method (illustrative picture from Wikipedia),
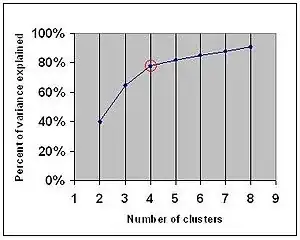
which compares the number of clusters with the variance that they explain. This technique would be perfect for my needs, but I don't know how to implement it in Ruby (or with pen and paper).
What stats technique can I use to calculate the number of clusters vs the percentage variance that they explain?