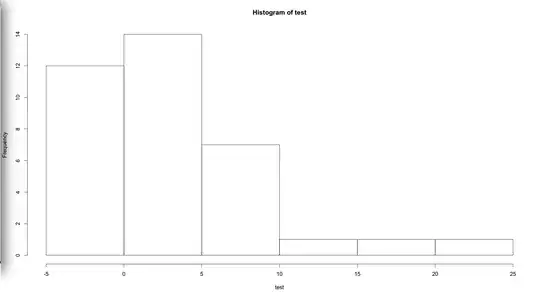
Consider the plot attached as the histogram of the outcome ($Y$) that is going to be the outcome in a linear regression. Clearly, the histogram shows the outcome is not normally distributed. How can I come up with a transformation that makes the data be normal so that I can fit a linear regression?
My goal is to compare the effect of TRT (treatment) vs. CTRL (control). One obvious regression is:
$Y = \mathrm{TRT} + \text{other covariates}$
Since $Y$ is not normal, do you think I can assess the TRT effect by considering $Y$ as a coefficient and TRT as outcome and fit a logistic regression?