I have a network and for each node in the network I am calculating a certain property, essentially its 'connectedness' to a set of source nodes. In order to identify nodes which are better connected than nodes at a similar geometric distance from the source nodes, I have grouped nodes into shells of given radii from the source nodes. So for instance, all nodes which lie within 0-2,2-4,4-6,... units of the source nodes. The following figure shows the distributions of 'connectedness' within the shells.
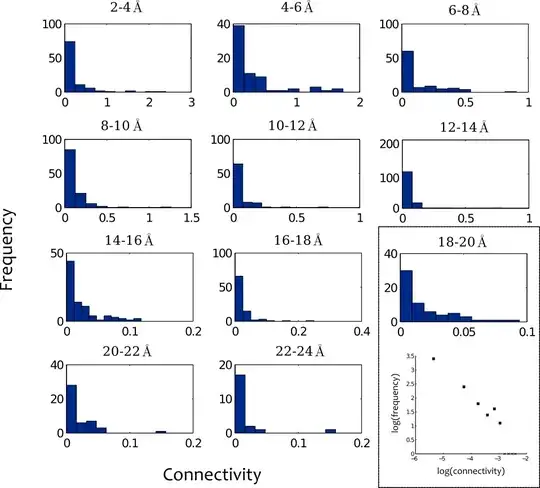
I think the best way to describe most of the distributions is that they look roughly straight on a log-log plot (as you can see in the boxed example) i.e. they have wide/long-tails. Clearly, they are not Gaussian. Ideally, I would like to calculate a single score for each node, which gives a measure of how 'unexpectedly' well connected it is and is comparable across shells. I started by using a z-score $\frac{x_i - \bar x}{\sigma}$, but given the distributions are far from normal this doesn't seem like the best measure. I have switched to a z-score based on the median $\frac{x_i - \text{median}(x)}{\sigma}$, but this still feels unsatisfactory.
Is there some kind of non-parametric measure which could be used to compare the significance of the outliers across shells and obtain a single ranking for all nodes in the network?