I am working on a method to detect a finite set of significant points of temperature change within a data series. Although my first pass does an okay job of detecting significant temperature transitions, the results are less than ideal when working with a noisy signal or weak temperature variance.
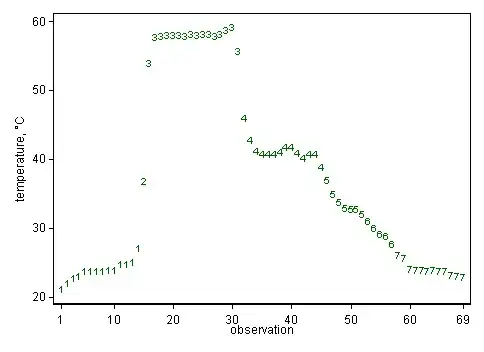
Sample Temperature Profiles
The X axis represents temperature and Y represents a sensor reading within the data set
Current Approach
- Apply Savitzky–Golay Filter using multiple passes with a small window size to smooth data.
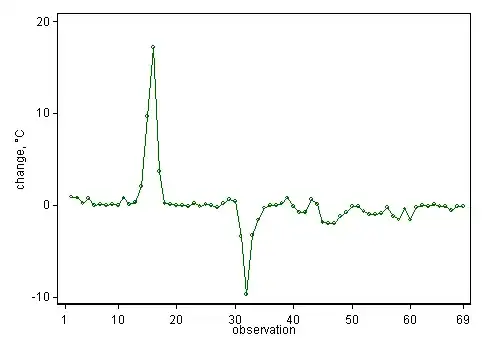
- Calculate rate of change on smoothed data series and calculate standard deviation.
- Starting with z-Score of 1.96 (~95% confidence) slowly increase or decrease confidence until I locate 2-5 significant temperature shifts that best fit the result of the previous data series or give up if I reach 0.84 (~60% confidence).
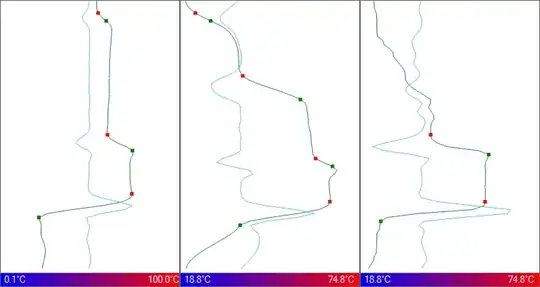
As illustrated in the left and middle profiles, this works okay; however there are times like the right profile where I need to detect changes in temperature that are weaker than my minimum allowed confidence of 60%. I know I could just continue to lower the bar (i.e., 50% or lower), but I am hoping there is a better approach.
Changes Considered
- Reduce the minimum confidence level to 50% or lower to detect weaker transitions.
- Given that there is normally a significant temperature increase on the lower half of the profile; break the data up into two halves at the maximum temperature reading (idea being variance on top half is typically weaker than the bottom half).
- Don't use standard deviation and find the most significant transitions by identifying peaks and valleys ranked by overall temperature change.
- Other…
I have been reading a lot of the related questions as well as scouring Wikipedia. I am fairly certain this is a well understood problem, and I am hoping someone can point me in the right direction on how to correctly identify the most significant changes in temperature given a small data series (72-120 values) while dealing with noise and weak variance.
EDIT 1
I neglected to mention that one of the challenges I am currently facing is that by applying the smoothing filter, I am negatively affecting my ability to detect weaker points of significant change.
EDIT 2
A raw sample data series (°C) representing the right temperature profile if needed…
21.00, 21.90, 22.70, 22.90, 23.60, 23.60, 23.70, 23.70, 23.80, 23.80, 24.60, 24.70, 25.00, 27.00, 36.70, 53.90, 57.60, 57.80, 57.90, 57.90, 57.90, 57.80, 58.00, 57.90, 58.00, 58.00, 57.80, 58.00, 58.60, 59.00, 55.60, 45.90, 42.60, 41.00, 40.70, 40.70, 40.70, 40.90, 41.70, 41.60, 40.80, 40.00, 40.60, 40.70, 38.80, 36.80, 34.80, 33.60, 32.80, 32.70, 32.60, 31.90, 30.90, 29.90, 29.00, 28.80, 27.60, 26.00, 25.60, 24.00, 23.80, 23.80, 23.70, 23.80, 23.70, 23.60, 23.00, 22.90, 22.80