2

I am looking for some help with my time-series data. What is the best method of detrending/transformation of these two variables, so I do not violate assumptions of stationarity when applying a cross correlation function (to find out if one series is leading the other)? enter image description here

The cross correlation function shows that the raw series are correlated when HDA is shifted back two year, but applying this without transformation of data and error structure would be wrong. Because I am working with scaled variables from 0 to 1 and because my x variable contains zeroes, I am not sure what is the best way to go about this (I can correct for non-constant mean via OLS detrending, but don't know how to address non-constant variance and non-independence of errors). Could this type of question be answered with wavelets?

The y variable is a time series of biomass (B) scaled to the maximum value of B. The x variable is a time series of the proportion of high density areas (HDA), scaled to the maximum value of HDA

y<-c(0.84685420,0.64096448, 0.61250603, 0.49262176, 0.34298023, 0.39499759, 0.23326153, 0.27661148, 0.52848738, 0.66898569, 0.71739592, 0.74696673, 0.78385469, 0.92071371, 0.96981193, 1.00000000, 0.95564700, 0.83825109, 0.67275358, 0.59576917, 0.42636232, 0.33447999, 0.30739109, 0.14768687, 0.14132776, 0.08885388, 0.07370519, 0.08349140, 0.05824787, 0.04986337, 0.04616621, 0.04828163, 0.04666131, 0.02836843, 0.03283073, 0.09343192, 0.06804694, 0.06146279, 0.12578685, 0.17464716, 0.30159781, 0.33469217)

year<-c(1970:2011)

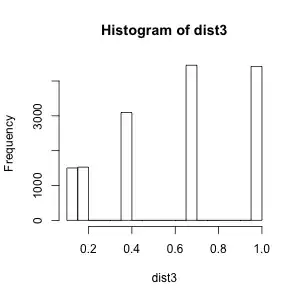
x<-c(0.00000000, 0.27272727, 0.09297521, 0.53827751, 0.17786561, 0.09977827, 0.10765550, 0.49889135, 0.29933481, 0.77922078, 0.85623679, 1.00000000, 0.47568710, 0.97402597, 0.39430449, 0.56426332, 0.31774051, 0.47661077, 0.27579162, 0.46487603, 0.38654259, 0.31168831, 0.15151515, 0.15293118, 0.00000000, 0.22113022, 0.00000000, 0.00000000, 0.16201620, 0.15437393, 0.00000000, 0.14229249, 0.00000000, 0.00000000, 0.00000000, 0.00000000, 0.14354067, 0.08704062, 0.00000000, 0.23830538, 0.07718696, 0.05928854)

ccf<-ccf(x,y,type="correlation", main="x=HDA/max(HDA), y=B/max(B)", ylab="ccf")

original biomass is

y<-c(131707, 99686, 95260, 76615, 53342, 61432, 36278, 43020, 82193, 104044, 111573, 116172,121909, 143194, 150830, 155525, 148627, 130369, 104630, 92657, 66310, 52020, 47807, 22969,21980,13819,11463,12985,9059,7755,7180,7509,7257,4412,5106,14531,10583, 9559,19563, 27162,46906, 52053)

logy<-log(y)

and I am looking at the scaled biomass so then that would be

logy.scaled<-logy/max(logy)

enter image description here

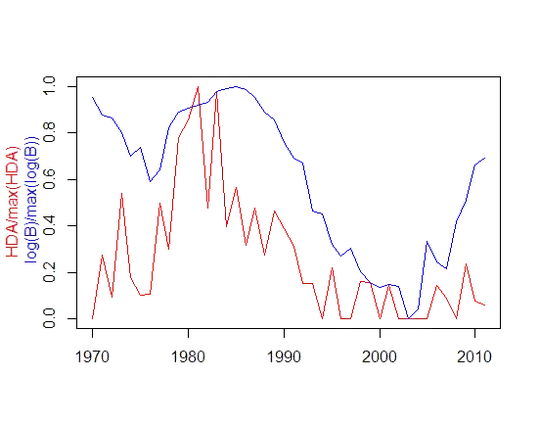
what would be the best way to apply a ccf? or other method to see the red series leads the blue in time?

EHR
  • 73
  • 1
  • 6

2 Answers2

1

As Nick knows from his interest in the History of Statistics, early practitioners would detrend BUT had to assume the number of trends and where they began and ended AND that the series didn't simply require de-meaning to deal with level shift(s). Later on practitioners ( mostly econometricians) used an alternative , by differencing the data to deal with the non-stationarity BUT the question is how many differences and the order of differencing was tacitly ignored. Box and Jenkins suggested the optimization of all these prior approaches by pre-filtering using an appropriate ARMA Model for the X variable above and beyond any identifiably needed differencing unique to each series to create surrogate series that could be usefully analyzed with the CCF.

IrishStat
  • 27,906
  • 5
  • 29
  • 55
  • Thank you IrishStat! Does this mean that if I apply a CCF of the residuals of the models **gls((x ~ year),correlation = corAR1(form = ~ year), method="ML")** and **gls((y ~ year),correlation = corAR1(form = ~ year), method="ML")** that would give me an outcome that would be meaningful? I am not sure how these models deal with autocorrelation of the error terms though (residuals still look autocorrelated when I do an ACF of the gls model residuals). Do I have to apply a transformation before detrending? Arcsine doesn't help much though. – EHR Sep 09 '13 at 08:17
  • I have analyzed your data but I can't post the jpg files because "framing is not allowed" . I don't understand. If tou wish you can contact me directly and I will send you the very interesting results. – IrishStat Sep 09 '13 at 10:23
1

This question looks backwards to me, in that you seem to have set ideas on what statistical methods you want to apply, yet it's not at all obvious that any of the methods you mention will make much scientific sense.

The first question is What is happening here in terms of your biological system? It's difficult for anyone to summarize even qualitatively but it's a complicated pattern of fluctuation, decline and recovery. So what arguments lead to the idea that a linear trend makes sense, even as a crude first approximation? What arguments lead to the notion that there is any kind of stationarity here?

The technique should be on tap, not on top.

Wanting to know how to cross-correlate residuals from a highly dubious model is not the main question as I see it. It is: do you have enough information to build an adequate model of your system?

Nick Cox
  • 48,377
  • 8
  • 110
  • 156
  • Neither time-series is stationary. I am not set on using one statistical method over the other. I am trying to look for the most appropriate one. My objective is to find out whether one timeseries is leading the other timeseries. I am not sure what is the best way to go about this though. I just got an explanation of autobox (much appreciated!), but was hoping to apply a less complicated model.. – EHR Sep 09 '13 at 12:40
  • We all sympathise with that, but do you have enough information on driving processes to get near that objective? – Nick Cox Sep 09 '13 at 12:56
  • yes, from ecology perspective,it appears that red could be driving the blue series. But I would like to find out whether changes in red could be considered to precede changes in blue, more in terms of using red as an indicator for changes in blue (I am less interested in whether one is causing the other) – EHR Sep 09 '13 at 13:23
  • The scaling to [0,1] does not seem essential for biomass. Why not work with log biomass? – Nick Cox Sep 09 '13 at 13:38
  • I did not use log biomass because I was interested in the shape of the relationship between the biomass and the HDA variable. I wanted to understand if we would see a relatively larger decline (using proportions relative to the maximum) in one variable vs. the other; i.e. detect if there is non-linearity in the relationship between proportion of total biomass and the proportion of total HDA. And now I would like to understand whether there is directionality in the non-linear relationship.. does red precede blue in time? – EHR Sep 09 '13 at 13:53
  • Sorry, but that seems to be the wrong way round. Checking for nonlinearity is not accomplished by dividing both variables by constants, different or otherwise. Being interested in relative decline (or growth) is precisely why a logarithmic scale is used. – Nick Cox Sep 09 '13 at 13:58
  • One of the variables (HDA) however already comes in percentages... – EHR Sep 09 '13 at 14:05
  • I understand that and I note the zeros. By suggestion is entirely that biomass be looked at on logarithmic scale. – Nick Cox Sep 09 '13 at 14:07
  • is it ok to just take the log of biomass and not the other variable? I find taking the log of biomass, then scaling it to the maximum value and assessing the relationship with HDA (not log transformed) difficult to interpret... – EHR Sep 09 '13 at 15:08
  • Anything with positive values that might be expected to grow can be looked at on a log scale. Whether it helps is a different matter. (As before, scaling is not to the point here, I think.) The basic idea is that exponential growth or decline becomes linear on logarithmic scale. M.H. Williamson, Analysis of Biological Populations (1972) has a good brief discussion (assuming you are an ecologist or similar). – Nick Cox Sep 09 '13 at 15:20
  • Thank you for the suggestion. The scaling comes from a paper by Harley et al 2001 (http://www.fmap.ca/ramweb/papers-total/is_cpue_proportional.pdf) where they wanted to know the shape of the relationship between two variables and compare among species. I want to compare Biomass with HDA (x) and Biomass with other x variables or indices, so it will be difficult for me to interpret and compare if some of the x's are on a log scale and others aren't. – EHR Sep 09 '13 at 16:03
  • As I've stressed before, indeed twice, I am not suggesting taking logs of anything except biomass. – Nick Cox Sep 09 '13 at 16:10
  • Sorry, I understand now... So if I take the log of biomass, then I get the picture and the data that I added to my original question above. Would you be able to guide me to applying a CCF properly? – EHR Sep 09 '13 at 16:35
  • I am not sure that a "proper" method exists without a serious model for your time series that respects the biological mechanims. But at one level CCF is just descriptive statistics, so I would look at cross-correlation of (a) raw data and (b) after smoothing. – Nick Cox Sep 09 '13 at 16:42