Your data are clear and obvious and tests can't actually "prove" anything anyway. What you really are asking is how to quantify how much the "Grand Total %CR" depends on the Google results.
There are various terms for such things, which are called "sensitivity," "leverage," "influence," etc. The idea uniting them all is that when you change one number that goes into a summary and the summary doesn't budge (much), then the summary is not sensitive to the number you changed. When the summary changes a lot, it is sensitive to the change. We can measure this.
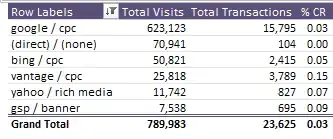
Sensitivities can be computed in various ways, depending on how we quantify amounts of change. Consider raw changes in the %CR column, for instance. Evidently increasing Google's value from $0.03$ to $0.04$ would affect the bottom line much more than a similar $+0.01$ increase in any of the five other %CR values. Let's work out how much. To keep the formulas brief, number the rows of the table $1$ through $6$ from top to bottom and refer to the Total Visits as $V$, Total Transactions as $T$, and %CR as $R$ (a mnemonic for "ratio"). Use the row numbers as subscripts; when no subscript appears, we mean the value on the bottom line. For instance, we may refer to the value $2415$ for the bing/cpc Total Transactions on line $3$ as $T_3$. The total number of transactions is $T = 23625$.
The table is constructed so that:
In each row $i$, $R_i = T_i/V_i$. (Notice this is not a percent! It's just the ratio.)
$T = T_1+T_2+\cdots+T_6$ and $V = V_1+V_2+\cdots+V_6$: these are true totals.
$R = T/V$. Notice this value, equal to $0.0299$, differs from the average $\bar{R} = \left(R_1+R_2+\cdots+R_6\right)/6 = 0.0640$.
To find the sensitivities we employ rules of Calculus to differentiate $R$ with respect to the data. The wording of the question suggests that the sensitivity of $R$ with respect to the $R_i$ is of concern. When changing $R_i$ we imagine this being caused primarily by changes in the response $T_i$ rather than the underlying intensity $V_i$. Because $R$ is not directly expressed in terms of the $R_i$, begin with an algebraic manipulation to express it in terms of the total visits and CR values:
$$R = \frac{T_1+T_2+\cdots+T_6}{V_1+V_2+\cdots+V_6} = \frac{V_1R_1+V_2R_2+\cdots+V_6R_6}{V}.$$
Now we may compute
$$\frac{\partial R}{\partial R_i} = \frac{V_i}{V}.$$
Let's make a table of these sensitivities:
Row              Sensitivity
---------------- -----------
google/cpc             0.789
(direct)/(none)        0.090
bing/cpc               0.064
vantage/cpc            0.033
yahoo/rich media       0.015
gsp/banner             0.010
For instance, the bing/cpc value is $V_3/V = 50821/789983 = .06433...$, rounded to $0.064$ for easy comprehension.
To make Google's domination of CR obvious, a simple graphic will suffice:
An increase by $0.01$ (one percent) in Google's CR value will have almost $0.79/0.09\approx 9$ times the effect on the overall CR value than the next most influential row and it will have $79$ times the effect (actually $83$ times when computed more precisely) of the least influential row.
Calculations of this sort are readily carried out with statistical computing software such as R. Here is the code I used:
V = c(623123, 70941, 50821, 25818, 11742, 7538)
names(V) <- c("google/cpc", "(direct)/(none)", "bing/cpc", "vantage/cpc",
              "yahoo/rich media", "gsp/banner")
T = c(15795, 104, 2415, 3789, 827, 695)
R = T/V
R.sens <- V/sum(V)

palette(terrain.colors(6))
b <- barplot(R.sens, main="CR Sensitivity", col=1:6)
h <- R.sens + 0.05; h[1] <- h[1]/2
text(b, h, labels=format(R.sens, digits=1))