I am using the bootstrap algorithm to compute standard errors of the estimates of my normalmixEM output. I am not really sure if they are reliable?
My code is (data here):
# load package
install.packages("mixtools")
library(mixtools)
B = 1000 # Number of bootstrap samples
mu1sample <- mu2sample <- sigma1sample <- sigma2sample <- lambdasample <- vector()
# Bootstrap
for(i in 1:B){
print(i)
subsample = sample(mydatatest,rep=T)
normalmix <- normalmixEM(subsample, mu=c(-0.002294,0.002866),sigma=c(0.00836,0.02196), lambda=c(0.6746903,(1-0.6746903)),k=2, fast=FALSE, maxit=10000, epsilon = 1e-16, maxrestarts=1000)
mu1sample[i] = normalmix$mu[1] # $
mu2sample[i] = normalmix$mu[2] # $
sigma1sample[i] = normalmix$sigma[1] # $
sigma2sample[i] = normalmix$sigma[2] # $
lambdasample[i] = normalmix$lambda[1] # $
}
# standard errors
sd(mu1sample)
sd(mu2sample)
sd(sigma1sample)
sd(sigma2sample)
sd(lambdasample)
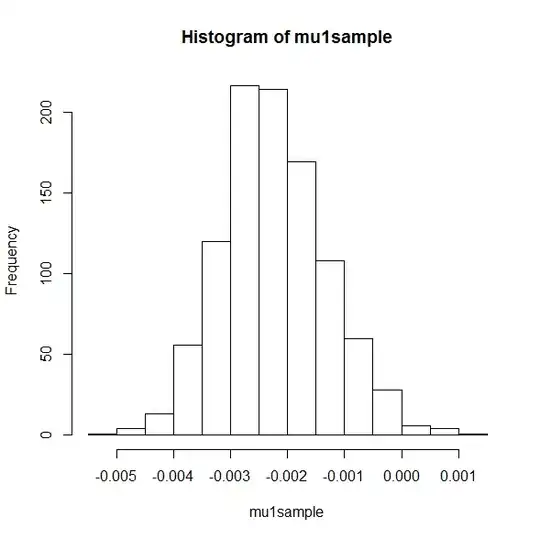
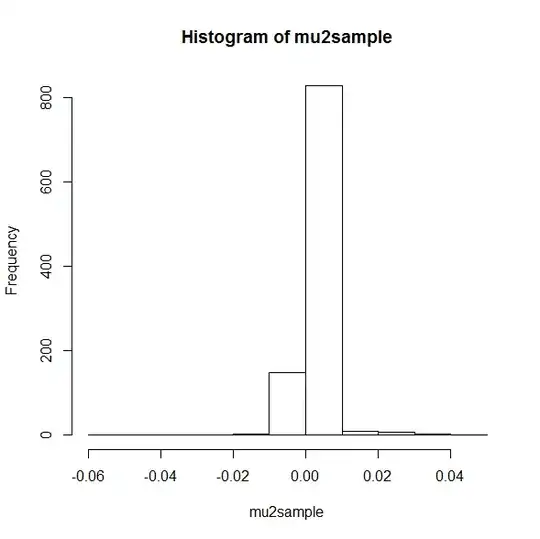
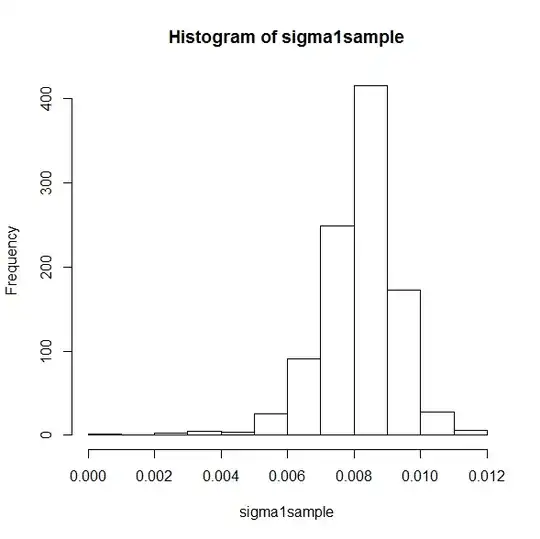
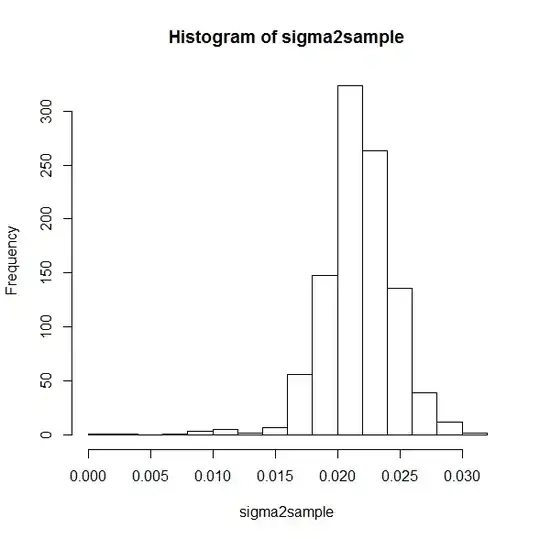
# show distribution of the bootstrap samples
hist(mu1sample)
hist(mu2sample)
hist(sigma1sample)
hist(sigma2sample)
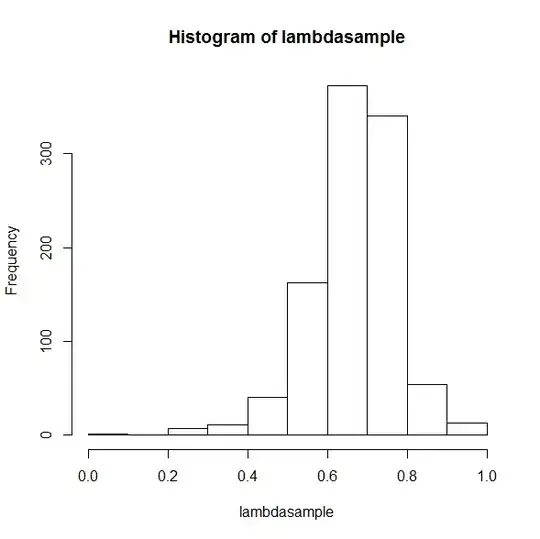
hist(lambdasample)
This gives the following pictures:
mu1
mu2
sigma1
sigma2
lambda
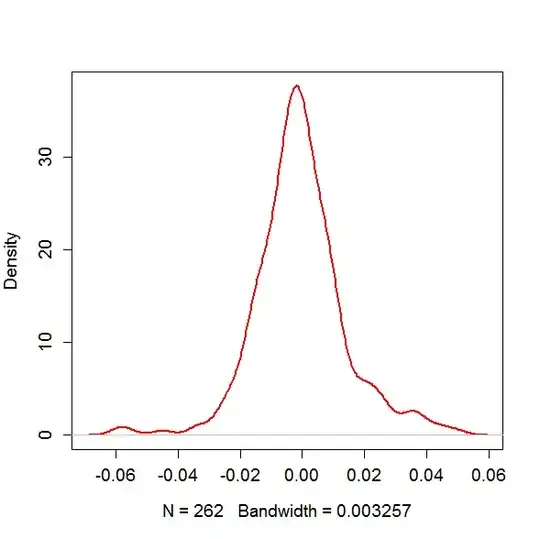
EDIT: If you look at my variable, the mydatatest and use a KD to show the distribution with the following code
plot(density(mydatatest),col="red",main="",lwd=2,cex.axis=1.2,cex.lab=1.2)
it looks like
2nd EDIT: I now included the mus and sigmas to be fixed. I updated the code and the pictures. Now again my question, what do you think about it?