3

I am trying to fit a spherical variogram to some synthetic data using the code available at http://www.mathworks.com/matlabcentral/fileexchange/25948-variogramfit. However, I have some doubts. I simulated some synthetic data using GMRF with the defined graph structure. I mean, I generated some samples where each sample is a multivariate gaussian distribution over space. I then took pairwise semi variances and got the overall semivariogram.

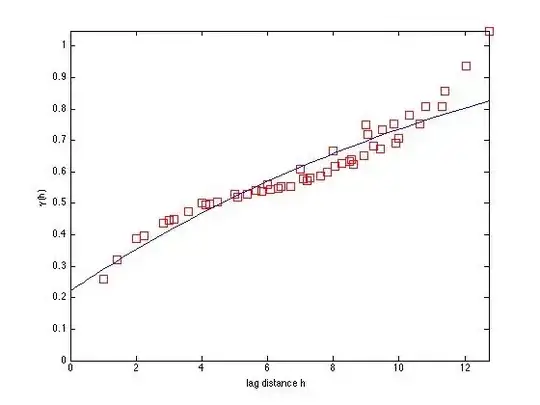
I then fit the model variogram to this empirical one. This is what I got. However, I have some doubts, when I generated the synthetic data it had no noise. So I was assuming no nugget effect. However, I am seeing significant nugget effect why is it so. I just drew samples from a multivariate gaussian distribution over space.

I have a spatial grid of size 10x10, the variables in this form a multivariate gaussian distribution. Any suggestions?

I am not sure but the more samples I add, and calculate the pair wise semi variance, the nugget starts increasing. Even though the empirical semi variogram is smoother, the nugget starts appearing more. What is the reason behind this?

enter image description here

user34790
  • 6,049
  • 6
  • 42
  • 64
  • For this question to become answerable you will need to supply the details of your simulation and your variogram construction. However, I see *no* evidence of a nonzero nugget: although your *fit* has a nugget, the *data* do not. You can check that yourself by generating values at sets of closely-spaced points (thereby filling in the values between lags of 0 and 1). – whuber Aug 03 '13 at 20:18
  • @whuber. Actually, I used a software to make the fit http://www.mathworks.com/matlabcentral/fileexchange/25948-variogramfit. It allows me to specify whether or not to add nugget when I fit a model variogram. I fits the variogram by minimizing the least squares error. If I don't fit the nugget it will be zero. But if I allow it to have the nuggets, it comes like this. Actually, I specified a gaussian markov random field by its precision matrix so that every node is connected to its 3x3 neighborhood. From this precision matrix, I got the $\Sigma$ matrix and then sampled from the gaussian. – user34790 Aug 04 '13 at 02:41
  • @whuber. I then took pairwise distances between the points and got the semi variance to calculate the empirical variogram. Then fit an exponential variogram to the empirical one – user34790 Aug 04 '13 at 02:42

0 Answers0