You know that the p-value is $P(t<-|tRatio|)+P(t>|tRatio|)$ and its value is computed by the CDF of a $t$ distribution with the proper number of degrees of freedom, i.e. $n-p$ where $n$ is the number of observations and $p$ the number of parameters.
To get the absolute value of tRatio at a given significance you can use the quantile function. Let me use a toy example in R:
> x <- c(1, 2, 3)       # independent variable
> y <- c(2.9, 5.2, 6.9) # dependent variable, n = 3 observations
> linreg <- lm(y ~ x)
> summary(linreg)       # p = 2 parameters
[...]
Coefficients:
            Estimate Std. Error t value Pr(>|t|)
(Intercept)   1.0000     0.3742   2.673    0.228
x             2.0000     0.1732  11.547    0.055 .
[...]
> tRatio <- 11.547      # n - p = 1 degree of freedom
> p_value <- pt(-abs(tRatio), 1) +            # P(t < -|tRatio|)
+     pt(abs(tRatio), 1, lower.tail = FALSE)  # P(t > |tRatio|)
> p_value
[1] 0.0549957
You can compute the absolute value of tRatio at 5.49957% significance by the quantile function. Since it is a two sided test, you have to compute $F_t^{-1}(pvalue/2)$:
> abs(qt(p_value/2, 1))
[1] 11.547
You can compute the absolute value of tRatio at whatever significance by:
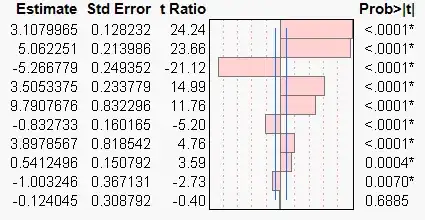
> abs(qt(0.05 / 2, 1)) # this is where those vertical lines come from
[1] 12.7062
> abs(qt(0.10 / 2, 1))
[1] 6.313752
So, if you are looking for 10% significance a tRatio > 6.314 or < -6.314 is enough.