5

I have a quick question:

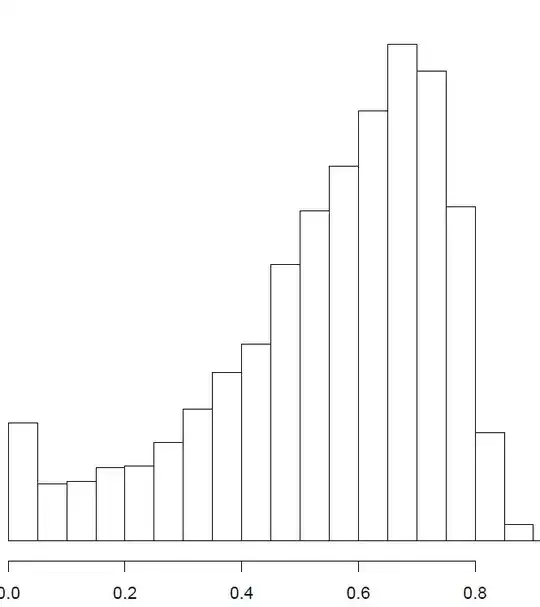
In using a t.test for multiple experiments, I got one p-value for each experiment.
When I plot the histogram of these p-values, I find the distribution looks like a bell-shaped curve, i.e. majority is centered around 0.5 to 0.8, very few > 0.9, but there are some < 0.05.

What can I tell from this pattern of p-value histogram?
Does it mean the test is flawed in some way?

Thanks!
enter image description here

Harvey Motulsky
  • 14,903
  • 11
  • 51
  • 98
alittleboy
  • 743
  • 1
  • 9
  • 29
  • 2
    It is difficult to reconcile your summary information with the description of the histogram as "bell-shaped," because it sounds rather skewed. Perhaps, to clarify your question, you could post the p-values or an image of the histogram? – whuber Jul 22 '13 at 20:04
  • 1
    You might be interested in a closely related question about the distribution of p-values: http://stats.stackexchange.com/questions/10613/why-are-p-values-uniformly-distributed. – whuber Jul 22 '13 at 20:10
  • @whuber: thanks! please see the attached histogram – alittleboy Jul 22 '13 at 20:13

1 Answers1

6

If the null hypothesis is true, you expect a uniform distribution. If the null hypothesis is not true, then you'd expect more small P values. But you have more high P values, which is strange.

Two ideas:

  • Are you computing one tail P values? If so, and the actual effect is in an opposite direction to the hypothesized effect (and you compute the one-tail P values correctly), then you'd expect more high P values.

  • How subjective is the data collection and wrangling? Any chance that the people doing the experiment expect no difference, so are biased? Perhaps they throw out "outliers" only when they see an unexpected large difference? Perhaps they repeat the measurement when the difference (effect) is unexpectedly large, but accept it when the effect is small?

Harvey Motulsky
  • 14,903
  • 11
  • 51
  • 98
  • thanks! yes, this is the result of a 1-sided two-sample t-test, and I think the author (R package) correctly specified the side of the test... so do you think it is possible that it's due to the actual effect being in an opposite direction to the hypothesized effect? In such case, I don't think we can change the side from "less" to "two-sided" since our hypothesis is fixed beforehand... is that correct? – alittleboy Jul 22 '13 at 22:03
  • 1
    @alittleboy. Are the findings (on average) in fact in the direction opposite to your hypothesis? You should be able to figure that out by looking at the differences, without thinking about P values. – Harvey Motulsky Jul 22 '13 at 22:25
  • thanks! i think this weird result is because the samples in the t-test are not independent, so it's not appropriate to use a 2-sample t-test which may give misleading results sometimes. I think if I use permutation test to calculate p-values, the distribution would make more sense – alittleboy Jul 23 '13 at 12:53