3

Much has been written on the ICC and Kappa, but there seems to be disagreement on the best measures to consider.

My purpose is to identify some measure which shows whether there was agreement between respondents an interviewee administered questionnaire. 17 people gave ratings of 0-5 to a defined list of items, rating them according to importance (NOT ranking).

I am not interested in whether the 17 participants all rated exactly the same, but only whether there is agreement that it should be rated high or not.

Following suggestions here, I have used the ICC and also Kappa but different results were produced as follows:

Kappa results

ICC results

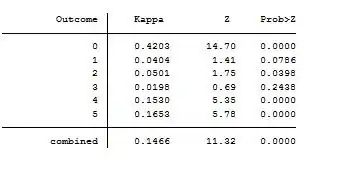
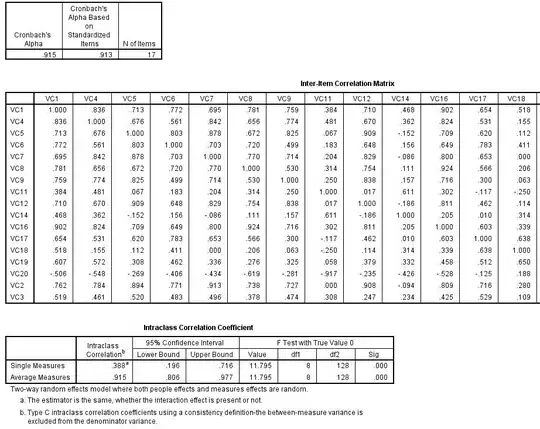
Also I note that given the very small sample, the validity of the ICC could be questionable due to the use of the f test see this question

What are your suggestions, and way forward to comment on this

Cesare Camestre
  • 699
  • 3
  • 15
  • 28
  • 3
    Can you provide the code that you ran to get the kappa? – Jeremy Miles Jul 19 '13 at 15:42
  • 1
    Kappa was run in stata.. kap and the variable names. Kappa also uses normal distribution (in the testing) which could be an issue with the small data, so any guidance on this would be appreciated. – Cesare Camestre Jul 19 '13 at 15:53
  • 1
    I'm not sure that you would necessarily expect Kappa to be similar to ICC? With that in mind, it looks to me like the ICC and Kappa both show highly significant levels of inter-rater agreement overall... However, I don't feel qualified to comment on the validity (we need a statistician here). – atrichornis Jul 20 '13 at 02:09
  • 1
    kappa is only 0.1466.. – Cesare Camestre Jul 20 '13 at 22:20
  • 2
    The request to see exact code from @Jeremy Miles remains unanswered. – Nick Cox Jul 20 '13 at 22:39
  • I already said, kap and the variable names @Nick Cox – Cesare Camestre Jul 21 '13 at 03:28
  • That does not qualify as exact code in my view. You might as well say "I got puzzling regression results" and then explain by saying that you used Stata command `regress`. You have to give busy people a fighting chance to try replicating your results; otherwise they will just decide that you haven't stated a soluble problem. – Nick Cox Jul 21 '13 at 09:15
  • Well the exact entry was kap vc1 vc2 vc3 vc4 vc5 vc6 and so on. Nothing more. – Cesare Camestre Jul 21 '13 at 09:33
  • @NickCox there's nothing more in the entry apart from kap and the variable names. – Cesare Camestre Jul 22 '13 at 09:17
  • @CesareCamestre you'd be surprised how often a simple cut and paste of syntax reveals the answer to the problem. People get their rows and columns the wrong way round for example. – Peter Ellis Jul 23 '13 at 06:49
  • @PeterEllis as I said, the code is simply kap and the variable names of each judges answers. – Cesare Camestre Jul 23 '13 at 10:49

2 Answers2

5

The issues are much better explained in chl's answer Inter-rater reliability for ordinal or interval data

Here are some observations, based on a quick perusal of Wikipedia:

  • Cohen's Kappa and the Intra-Class Correlation are measuring different things and are only asymptotically equivalent (and then only in certain cases) so no reason to expect them to give you the same number in this case.
  • the statistical tests are comparing the values of these two statistics to a null hypothesis of zero ie completely random ratings as far as inter-rater agreement goes. This is presumeably an uninteresting null hypothesis anyway (it would be a very sad test that failed to knock out that null hypothesis!), so I don't see why you'd worry too much about the exact shape of the distribution of the F statistic under it.
  • From what I read, the actual interpretation of these statistics (what is a "good" level of agreement between raters, once we're sure that at least it's not zero) is arbitrary and based on judgement and subject matter knowledge rather than statistical test.
  • The Kappa statistic appears to ignore the ordered nature of the original scale ie treats them as arbitrary categories rather than different levels on a scale. That is how I interpret the Stata output that looks individually at the agreement for each level 0, 1, 2 etc. Whereas the ICC seems to go to the other extreme and treat it as a continuous variable in a mixed effects model. Of the two evils, I'd go with the one that at least acknowledges - that 0 < 1 < 2 < 3 < 4 < 5 ie the ICC.
  • I gather there is such a thing as a weighted Kappa, which takes into account the ordinal nature of the data by incorporating the of diagonals of an agreement-disagreement table (ie how far out each rating was) but without seeing your code and knowing more about how the data are coded in Stata it appears you aren't using this option - certainly it doesn't seem to be signalled in the Stata output..
Peter Ellis
  • 16,522
  • 1
  • 44
  • 82
  • above I didn't use a mixed effects model. The output for the ICC is from spss. Im not sure re pt 2 above, can you clarify? I wasn't expecting the same no but a similar result rather than opposing result. – Cesare Camestre Jul 21 '13 at 03:35
  • My understanding from https://en.wikipedia.org/wiki/Intra-class_correlation_coefficient is that the ICC can be conceptualised as a side produce of a mixed effects model with the original ratings as the response variable. On the 'similar rather than opposing', the results are both positive aren't they? So I wouldn't say they were opposing. – Peter Ellis Jul 21 '13 at 03:41
  • One seems to say respondents answered similarly and one hardly. How can I explain more technically the irrelevance of the f test – Cesare Camestre Jul 21 '13 at 03:46
  • 1
    The clue is in SPSS' output where it says "F test with true value is zero". So it is looking for evidence against the null hypothesis of an ICC of zero. This is only relevant for you if that is your null hypothesis. – Peter Ellis Jul 21 '13 at 03:52
  • 3
    +1, nice answer. If you use quadratic weights, you should expect the weighted Kappa answers and ICC answers to be equivalent (e.g. p. 187 of Streiner and Norman, "Health Measurement Scales" -- "If this [quadratic] weighting system is used, then the weighted kappa is exactly identical to the intraclass correlation coefficient" which cites Fleiss, J. L. and Cohen, J. (1973) "The equivalence of weighted kappa and the intraclass correlation coefficient as measures of reliability" in Educational and Psychological Measurement, Vol. 33 pp. 613–619) – James Stanley Jul 23 '13 at 00:25
  • @JamesStanley Stata does not allow the use of quadratic weighted kappa for more than 2.. – Cesare Camestre Jul 23 '13 at 11:28
0

Cohen's Kappa is for ordinal / categorical data (as in your example), whereas ICC is for continuous data. Therefore, you get conflicting results, and even if you don't, you should be using Cohen's Kappa (weighted for ordinal data). For examples see: http://www.sciencedirect.com/science/article/pii/S1556086415318876

ambalashes
  • 51
  • 4