0

$F<(1-\alpha/2, n_x-1, n_y-1)$ and $F>(\alpha/2, n_x-1, n_y-1)$. (Testing equality of population variances).

An alpha of $0.0$5 is used. $1-\alpha/2= 1-0.05/2= 1-0.025= 0.975$. However, there is no alpha value of $0.975$ in the $F$ table I have.

It only has alpha values of $0.05, 0.025, 0.01, 0.001$.

Do I simply use the alpha value closest to $0.975$, in this case $0.05$?

Or is there a way to actually read off $0.975$?

COOLSerdash
  • 25,317
  • 8
  • 73
  • 123
aboabo
  • 51
  • 1
  • 1
  • 4

2 Answers2

2

0.05 is not at all "close to" 0.975.

If your tables only have upper tail area critical values, then you need to make use of the fact that the critical value $x$ for $F_{(p,\nu_1,\nu_2)}$ is the reciprocal of the critical value for $F_{(1-p,\nu_2,\nu_1)}$. (Note that the order of the df swapped, as well as which tail.)

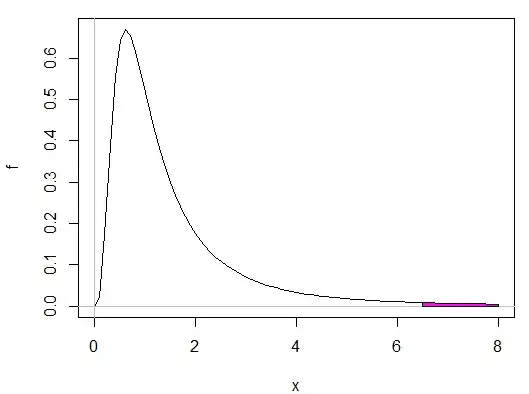
This means, for example, that if $n_1-1 = 5$ and $n_2-1 = 13$ the lower tail 0.025 F critical value is the same as the reciprocal of the upper tail critical value (area of 0.025 to the right, or 0.975 to the left) for an F with $n_1-1 = 13$ and $n_2-1 = 5$. For example, checking this in R:

 qf(.975,13,5)
[1] 6.48758           #That is an upper tail critical value cutting off 0.025
 1/qf(.975,13,5)
[1] 0.1541407         #That's it's reciprocal
 pf(0.1541407,5,13)
[1] 0.025             #which cuts of 0.025 area in the lower tail when you swap the df

$\quad\quad\quad\quad\quad F_{(13,5)}(x);\text{Upper tail area = 0.025, }x=6.488$ F 13,5,upper tail 0.025

$\quad\quad\quad\quad\quad F_{(5,13)}(x);\text{Lower tail area = 0.025, }x=\frac{1}{6.488}$ F 5,13, lower tail 0.025

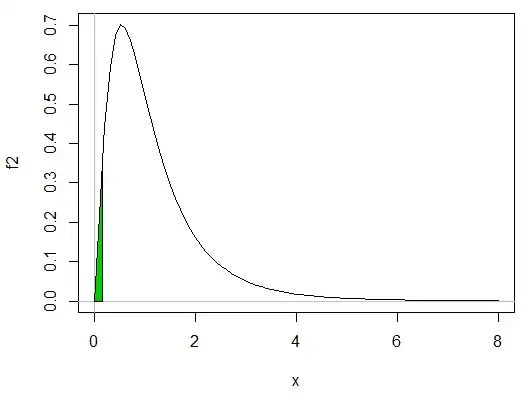
(The pink area looks smaller than the green because more than half the pink area is further to the right of 8.)

So as we see, this handy fact allows you to get lower-tail F values when you only have upper tail F tables.

--

Edit: Following up a question from the comments

See here for a detailed explanation of the use of interpolation for critical values, including an example involving $\log(α)$

Glen_b
  • 257,508
  • 32
  • 553
  • 939
  • Ok. So then as as long as the degrees of freedom are the same, the corresponding alpha values would also be the same? – aboabo Jul 15 '13 at 00:00
  • 1
    Your question is insufficiently clear. Can you be more explicit? – Glen_b Jul 15 '13 at 00:06
  • I was able to make more sense out of what you explained. However, I am now looking at a question with upper tail F being 0.2 and lower tail F being .98 . I am trying to apply what you explained but I am having difficulty as in this case, both 0.2 and 0.98 are not in the F table that I have. – aboabo Jul 15 '13 at 19:14
  • Do you mean 0.02? So you have a combined alpha of 4%? Or are your ends really asymmetric? – Glen_b Jul 15 '13 at 22:31
  • Yes, I mean .02 . "Construct the 96% interval for the ratio of two variances..." Therefore, alpha is 0.04. Right tail alpha is 0.04/2=0.02 and left tail alpha is 1-0.02= 0.98. So the two F's that I end up working with are .98 and .02. My F table does not have the values. It only has for 0.05,0.025,0.01,0.001. This is where I get difficulty applying what you explained as none of the 2 tail points are in the table. The numerator degrees of freedom are 14 and 10. – aboabo Jul 16 '13 at 02:00
  • Another question is "At the 4% significance level, test the claim that the population variances are equal against the alternative claim that the variances are unequal." I know how to do this. I have been working hypothesis tests of equality of variances for other problems, but I encounter difficulty as 0.04 is not in my table and to get F critical, I need to use the df (which I know) and the alpha (which I know) but the alpha of 0.04 is not in my table. This is what I have gathered on the method for calculating the F critical value (from watching youtube videos). – aboabo Jul 16 '13 at 02:04
  • It's easy enough to find in Excel (see `=FINV`) or in free stats packages like R (`?qf`), or in a number of other ways. If you *must* use your tables, the obvious means would be interpolation. – Glen_b Jul 16 '13 at 02:27
  • While linear interpolation in $\alpha$ isn't particularly accurate, as [the first page of this paper](http://www.jstor.org/discover/10.2307/2985223) (which page you can see without subscription) suggests\*, linear interpolation in the log of $\alpha$ should be reasonably accurate. In your case, linear interpolation in $\log(\alpha)$ gives 3.81 when the exact value (via Excel) is 3.79; pretty good; much more accurate than linear interpolation in $\alpha$, which gives 3.90. ... \*(It doesn't say that directly, but that's a consequence of what it does say there) – Glen_b Jul 16 '13 at 03:01
  • Would you believe I JUST read this document after searching in google?! I also got a pdf file from a university but I realize that both documents are concerned with the degrees of freedom being very different and not the alpha value. Youtube is of no help with this particular problem. I will still look around and see. Thank you very much for your help. – aboabo Jul 16 '13 at 04:28
  • that is not what I gathered. I thought you were saying that these materials actually covered df and not the alpha. I missed that then. So then how would you do the linear interpolation in log (a)? – aboabo Jul 16 '13 at 07:32
  • Misinterpretation. Simple. Don't get a heart attack. – aboabo Jul 16 '13 at 22:10
0

The usual comparisons with the F distribution are at the "right tail". Comparisons at the left tail could be done, but any identified discrepancy between the data and the model would imply the the model was fitting too well rather than measuring any "lack of fit".

If this is (as suggested by Glen_B) a request for assistance with the use of a ratio test for equality of variances, then perhaps consideration of a more robust and powerful alternative could be considered.

DWin
  • 7,005
  • 17
  • 32
  • 1
    As indicated at the end of the first line of the question, the OP is trying to [test a ratio of variances](http://en.wikipedia.org/wiki/F-test_of_equality_of_variances); that's a two-tailed test. – Glen_b Jul 15 '13 at 01:48