12

Is it possible to apply the usual MLE procedure to the triangle distribution? - I am trying but I seem to be blocked at one step or another in the math by the way the distribution is defined. I am trying to use the fact that I know the number of samples above and below c (without knowing c): these 2 numbers are cn and (1-c)n, if n is the total number of samples. However, that does not seem to help in the derivation. The moment of moments gives an estimator for c without much problem. What is the exact nature of the obstruction to MLE here (if indeed there is one)?

More details:

Let's consider $c$ in $[0,1]$ and the distribution defined on $[0,1]$ by:

$f(x;c) = \frac{2x}{c}$ if x < c
$f(x;c) = \frac{2(1-x)}{(1-c)}$ if c <= x

Let's take an $n$ i.i.d samples $\{x_{i}\}$ from this distribution form the log-likelihood of c given this sample:

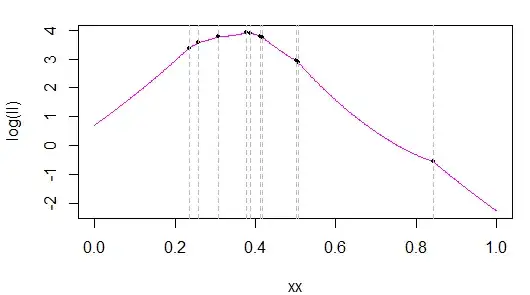
$\hat{l}(c | \{x_{i}\}) = \sum_{i=1}^{n}ln(f(x_{i}|c))$

I am then trying to use the fact that given the form of $f$, we know that $cn$ samples will fall below the (unknown) $c$, and $(1-c)n$ will fall above $c$. IMHO, this allows to decompose the summation in the expression of the log-likelihood thus:

$\hat{l}(c | \{x_{i}\}) = \sum_{i=1}^{cn}ln\frac{2 x_{i}}{c} + \sum_{i=1}^{(1-c)n}ln\frac{2(1-x_{i})}{1-c}$

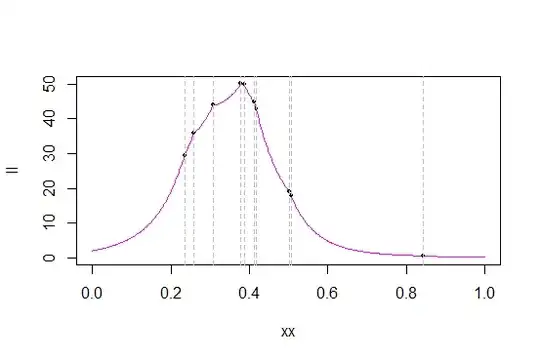
Here, I am unsure how to proceed. MLE will involve taking a derivative w.r.t. $c$ of the log-likelihood, but I have $c$ as the upper bound of the summation, which seems to block that. I could try with another form of the log-likelihood, using indicator functions:

$\hat{l}(c | \{x_{i}\}) = \sum_{i=1}^{n}\{x_{i}<c\}ln\frac{2 x_{i}}{c} + \sum_{i=1}^{n}\{c<=x_{i}\}ln\frac{2(1-x_{i})}{1-c}$

But deriving the indicators doesn't seem easy either, although Dirac deltas could allow to continue (while still having indicators, since we need to derive products).

So, here I am blocked in MLE. Any idea?

Glen_b
  • 257,508
  • 32
  • 553
  • 939
Frank
  • 1,305
  • 1
  • 12
  • 17
  • If this is for some subject please add the self-study tag. If it isn't, please explain how the problem arises. – Glen_b Jul 12 '13 at 00:12
  • Thanks for the update; it makes it much easier to say sensible things in answer, since it vastly reduces the scope of cases to deal with. Could you please consider my earlier comment. Either this falls under the self-study tag or it doesn't, in either case I have asked if you would do something. – Glen_b Jul 12 '13 at 01:10
  • This not for a homework or a class. It arises at my work. We have another estimator from method of moments, but I'm trying to get a deeper understanding of what is going on with MLE here. – Frank Jul 12 '13 at 01:54
  • Okay; that gives me more leeway. See my updated answer. I will probably make further additions soon – Glen_b Jul 12 '13 at 02:12
  • Added references/links – Glen_b Jul 12 '13 at 02:30

1 Answers1

10

Is it possible to apply the usual MLE procedure to the triangle distribution?

Certainly! Though there are some oddities to deal with, it's possible to compute MLEs in this case.

However, if by 'the usual procedure' you mean 'take derivatives of the log-likelihood and set it equal to zero', then maybe not.

What is the exact nature of the obstruction to MLE here (if indeed there is one)?

Have you tried drawing the likelihood?

--

Followup after clarification of question:

The question about drawing the likelihood was not idle commentary, but central to the issue.

MLE will involve taking a derivative

No. MLE involves finding the argmax of a function. That only involves finding the zeros of a derivative under certain conditions... which don't hold here. At best, if you manage to do that you'll identify a few local minima.

As my earlier question suggested, look at the likelihood.

Here's a sample, $y$ of 10 observations from a triangular distribution on (0,1):

0.5067705 0.2345473 0.4121822 0.3780912 0.3085981 0.3867052 0.4177924
0.5009028 0.8420312 0.2588613

Here's the likelihood and log-likelihood functions for $c$ on that data: likelihood for peak of triangular

log-likelihood for peak of triangular

The grey lines mark the data values (I should probably have generated a new sample to get better separation of the values). The black dots mark the likelihood / log-likelihood of those values.

Here's a zoom in near the maximum of the likelihood, to see more detail:

Detail of likelihood

As you can see from the likelihood, at many of the order statistics, the likelihood function has sharp 'corners' - points where the derivative doesn't exist (which is no surprise - the original pdf has a corner and we're taking a product of pdfs). This (that there are cusps at order statistics) is the case with the triangular distribution, and the maximum always occurs at one of the order statistics. (That cusps occur at order statistics isn't unique to the triangular distributions; for example the Laplace density has a corner and as a result the likelihood for its center has one at each order statistic.)

As it happens in my sample, the maximum occurs as the fourth order statistic, 0.3780912

So to find the MLE of $c$ on (0,1), just find the likelihood at each observation. The one with the biggest likelihood is the MLE of $c$.

A useful reference is chapter 1 of "Beyond Beta" by Johan van Dorp and Samuel Kotz. As it happens, Chapter 1 is a free 'sample' chapter for the book - you can download it here.

There's a lovely little paper by Eddie Oliver on this issue with the triangular distribution, I think in American Statistician (which makes basically the same points; I think it was in a Teacher's Corner). If I can manage to locate it I'll give it as a reference.

Edit: here it is:

E. H. Oliver (1972), A Maximum Likelihood Oddity,
The American Statistician, Vol 26, Issue 3, June, p43-44

(publisher link)

If you can easily get hold of it, it's worth a look, but that Dorp and Kotz chapter covers most of the relevant issues so it's not crucial.


By way of followup on the question in comments - even if you could find some way of 'smoothing off' the corners, you'd still have to deal with the fact that you can get multiple local maxima:

two local max

It might, however, be possible to find estimators that have very good properties (better than method of moments), which you can write down easily. But ML on the triangular on (0,1) is a few lines of code.

If it's a matter of huge amounts of data, that, too, can be dealt with, but would be another question, I think. For example, not every data point can be a maximum, which reduces the work, and there are some other savings that can be made.

Glen_b
  • 257,508
  • 32
  • 553
  • 939
  • Thanks - I'll try to post my failed attempt, showing what distribution I'm exactly talking about and where I think I am blocked. – Frank Jul 12 '13 at 00:25
  • Thanks for the detailed explanation! I had another idea though: suppose I could find a family of functions that converges to the triangle distribution, but would not be piecewise - could I use that to derive a MLE analytically, then take the limit and assume I would have a MLE of the triangle distribution itself? – Frank Jul 12 '13 at 04:40
  • Possibly - I think that might depend on the particular limit process you use ... and you'll likely still end up with several local maxima so it probably only saves you evaluating the likelihood near the extreme order statistics anyway -- but even if it worked, why would you even try to do something so complicated? What's wrong with ML on the triangular distribution? It's really quite simple to do in practice. – Glen_b Jul 12 '13 at 04:53
  • Well, there's nothing wrong in carrying out the procedure you describe with data, but it bugs me that I can't mathematically derive some kind of closed-form estimator, that's all :-) – Frank Jul 12 '13 at 05:37
  • With general distributions, no-closed-form is the rule rather than the exception. Consider the location-scale Cauchy family - which even has no corners, indeed it has continuous derivatives of all orders -- but there's no closed-form ML estimate of its center of symmetry. Real MLE isn't like the nice easy (mostly natural-exponential-family) book problems. – Glen_b Jul 12 '13 at 05:54
  • 2
    I must say, this MLE for c based on order statistics is pretty nice, although the derivation in the chapter above takes some work (not too hard though) - nice illustration that the essence of MLE is in the argmax (of course!), rather than the derivative (as you pointed out, and I fully agree, it occurred to me to work upstream of the "usual" derivative step (i.e. just worry about maximizing, by whatever means), but I didn't pursue). – Frank Jul 12 '13 at 06:07
  • 1
    @Frank: An additional reference is Huang and Shen (2007) [More maximum likelihood oddities](http://www.sciencedirect.com/science/article/pii/S0378375806002576), *Journal of Statistical Planning and Inference,* Volume 137, Issue 7, July, pp 2151-2155. Glen: By *order statistics*, do you just mean the ordered values $x_{i}$? – COOLSerdash Jul 12 '13 at 06:46
  • @COOLSerdash Indeed, yes, that's what [the order statistics are](http://en.wikipedia.org/wiki/Order_statistic). Specifically, the $i^{th}$ order statistic is the $i^{th}$ largest observation. The 1st order statistic is the minimum, the $n^{th}$ order statistic is the maximum. – Glen_b Jul 12 '13 at 09:25
  • @COOLSerdash Thanks for the additional reference; I hadn't seen it before. – Glen_b Jul 12 '13 at 09:29
  • Thanks for the additional reference, which amazingly is _free_ from Elsevier... – Frank Jul 12 '13 at 23:47
  • Incidentally, and that's a total tangent - is the beta distribution a kind of "Swiss army knife" distribution on compact intervals? I'm kind of guessing from the title "Beyond Beta" - I'm not a statistician. – Frank Jul 12 '13 at 23:51
  • Well, it's very widely used for things where you know the minimum, maximum and average, and used to model compositional data, and used as a mixing distribution for count-fractions and as a prior on them, and much else besides. Maybe not quite Swiss Army knife territory, but close. – Glen_b Jul 12 '13 at 23:59
  • Are you sure "the maximum always occurs at one of the order statistics"? For a two-element dataset it seems (unless I am mistaken in my calculation) that the maximum must occur at their *mean*, which will not be one of the order statistics (unless the two elements are equal). – whuber Oct 13 '14 at 00:06
  • @whuber I wonder if perhaps we're not dealing with the same object. I think there is an explicit solution for the MLE with two data points (unlike at higher $n$), but the maximum still occurs at a data point. Except in special cases, the mean doesn't seem to be either a local maximum or minimum. I've done a number of numerical examples to double check, I don't see anything that would lead to exceptions at n=2. – Glen_b Oct 13 '14 at 02:43
  • @whuber To be more explicit, I think (with n=2), the point further from 0.5 is the argmax. Interestingly, if the two points lie either side of 0.5 (they needn't be symmetric), it looks like 0.5 is an antimode, which is neat. – Glen_b Oct 13 '14 at 02:47
  • You're right; we're not talking about the same thing. Please forgive me for confusing the issue. I came here from the link in your comment at http://stats.stackexchange.com/questions/119732/what-would-be-the-likelihood-function-of-a-pdf-pn-1-n-for-n1#comment228316_119732 but neglected to read this question carefully. I see now that it deals with a different family of distributions than the one you linked from (which calls for estimation in a *location* family of triangular distributions rather than the *shape* family contemplated here). – whuber Oct 13 '14 at 04:10
  • @whuber Yes, it's different, sorry to confuse you. This post is related to the triangular distribution on $(a,b)$, and so I thought this may have some relevance to the problem there, but my other comments were more directly related. Without working it through, I'd expect the MLE of the location on the other one to relate to the midrange. – Glen_b Oct 13 '14 at 04:23
  • I expected it to be related to midranges, too, but (except in special circumstances, and then only with an approximation) cannot obtain such a result. – whuber Oct 13 '14 at 04:33