8

i am working to create a mapping of the adjacencies between 100 consumer goods. I have created an adjacency matrix based on product characteristics, and then create an i-graph of the graph/network (using tkplot / igraph)

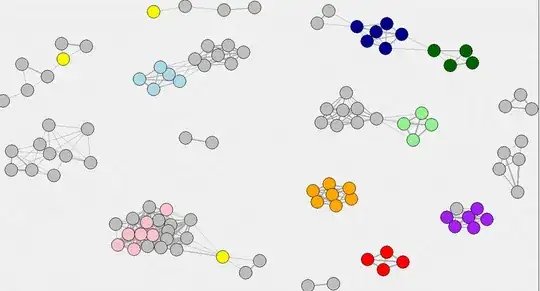
I am using the fruchterman reingold force-directed mapping algo to place the vertices, and get a nice picture of a 8-10 connected cliques.

Probably partly due to lack of understanding on how forec-directed mapping algos really work(and maybe should require me to do a lot more basic studying), but does the positioning of different cliques across the "page" by the fruchterman-rheingold algorhytm contain any information. E.g. - does the fact that i have two cliques in the bottom right corner, a small clique in the middle and a massive clique in the top left corner say anything about the characteristics / similarities between these cliques, or is just random spacing across the space to improve visual clarity?

Apologies if not clear - W

enter image description here

Wouter
  • 2,102
  • 3
  • 17
  • 26
  • Yes, there is information in the placement, for example centrality. Perhaps it is possible for you to add a link to the data or show a picture of the graph? – FredrikD Jul 11 '13 at 18:00

1 Answers1

3

If the subgraphs are not connected to each other, as in your picture, then their relative placement is arbitrary. Fruchterman-Reingold layout is only based on connections.

xan
  • 8,708
  • 26
  • 39
  • Exactly. The vertices within components are placed "non-randomly", the placement of the components is essentially arbitrary. – Gabor Csardi Jul 13 '13 at 00:30
  • @user19856 has suggested the following "minor characteristicos implementation": There are some "variations" of the same method: some "fix" one vertice on centrer of picture and let the other "to gravite" around it. I dont know how these implementatins works, but if you look the code, perhaps you can fix some vertice (e.g. the most connected) AADF – gung - Reinstate Monica Jul 17 '13 at 14:32