16

I am interested in the modeling of binary response data in paired observations. We aim to make inference about the effectiveness of a pre-post intervention in a group, potentially adjusting for several covariates and determining whether there is effect modification by a group that received particularly different training as part of an intervention.

Given data of the following form:

id phase resp
1  pre   1
1  post  0
2  pre   0
2  post  0
3  pre   1
3  post  0

And a $2 \times 2$ contingency table of paired response information:

\begin{array}{cc|cc} & & \mbox{Pre} & \\ & & \mbox{Correct} & \mbox{Incorrect} \\ \hline \mbox{Post} & \mbox{Correct} & a & b&\\ & \mbox{Incorrect} & c& d&\\ \end{array}

We're interested in the test of hypothesis: $\mathcal{H}_0: \theta_c = 1$.

McNemar's Test gives: $Q = \frac{(b-c)^2}{b+c} \sim \chi^2_1$ under $\mathcal{H}_0$ (asymptotically). This is intuitive because, under the null, we would expect an equal proportion of the discordant pairs ($b$ and $c$) to be favoring a positive effect ($b$) or a negative effect ($c$). With the probability of positive case definition defined $p =\frac{b}{b+c}$ and $n=b+c$. The odds of observing a positive discordant pair is $\frac{p}{1-p}=\frac{b}{c}$.

On the other hand, conditional logistic regression uses a different approach to test the same hypothesis, by maximizing the conditional likelihood:

$$\mathcal{L}(X ; \beta) = \prod_{j=1}^n \frac{\exp(\beta X_{j,2})}{\exp(\beta X_{j,1}) + \exp(\beta X_{j,2})}$$

where $\exp(\beta) = \theta_c$.

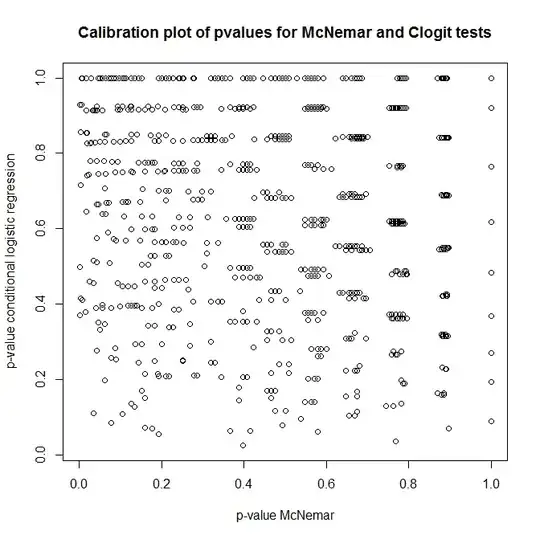
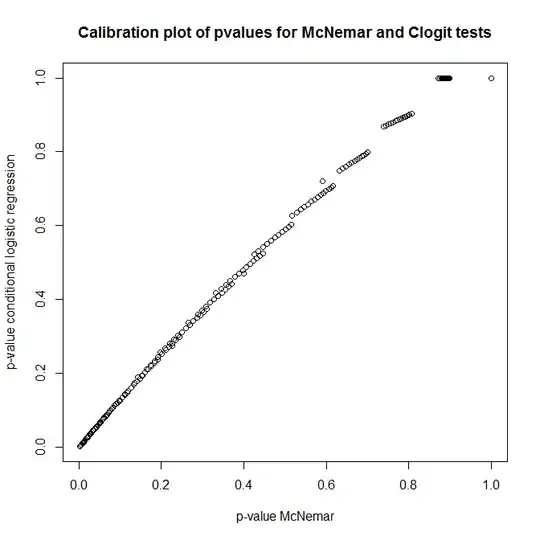
So, what's the relationship between these tests? How can one do a simple test of the contingency table presented earlier? Looking at calibration of p-values from clogit and McNemar's approaches under the null, you'd think they were completely unrelated!

library(survival)
n <- 100
do.one <- function(n) {
  id <- rep(1:n, each=2)
  ph <- rep(0:1, times=n)
  rs <- rbinom(n*2, 1, 0.5)
  c(
    'pclogit' = coef(summary(clogit(rs ~ ph + strata(id))))[5],
    'pmctest' = mcnemar.test(table(ph,rs))$p.value
  )
}

out <- replicate(1000, do.one(n))
plot(t(out), main='Calibration plot of pvalues for McNemar and Clogit tests', 
  xlab='p-value McNemar', ylab='p-value conditional logistic regression')

enter image description here

Randel
  • 6,199
  • 4
  • 39
  • 65
AdamO
  • 52,330
  • 5
  • 104
  • 209
  • It is interesting! The two methods should have similar results according to the theory. If I understand the question correctly, the null hypothesis of McNemar's test is $p_b=p_c$, while the null hypothesis of the test of conditional logistic regression is odds ratio $ad/bc=1$ within a stratum. – Randel Jul 18 '13 at 21:29
  • I seem to recall that one can parameterize the McNemar's test as a test of an odds ratio, so I wonder how one would write out the likelihood (conditional likelihood?) for that test. – AdamO Jul 19 '13 at 04:51
  • I am not sure if you mean the exact version of McNemar's Test. [Breslow and Day (1980)](http://w2.iarc.fr/en/publications/pdfs-online/stat/sp32/SP32.pdf), p. 164-166 and [package](http://cran.r-project.org/web/packages/exact2x2/vignettes/exactMcNemar.pdf) `exact2x2` may be references. – Randel Jul 19 '13 at 22:10

2 Answers2

5

Sorry, it's an old issue, I came across this by chance.

There is a mistake in your code for the mcnemar test. Try with:

n <- 100
do.one <- function(n) {
  id <- rep(1:n, each=2)
  case <- rep(0:1, times=n)
  rs <- rbinom(n*2, 1, 0.5)
  c(
    'pclogit' = coef(summary(clogit(case ~ rs + strata(id))))[5],
    'pmctest' = mcnemar.test(table(rs[case == 0], rs[case == 1]))$p.value
  )
}

out <- replicate(1000, do.one(n))

enter image description here

eusebe
  • 221
  • 2
  • 6
  • Wow! Thank you and welcome to the community. Just to clarify, McNemar works on discordant matched pairs (?) are such pairs dropped out of clogit? I don't see how id is involved in the calculation of the mcnemar results. Perhaps generating a correlation in these would help elucidate what clogit is doing. – AdamO Feb 26 '14 at 17:32
2

There are 2 competing statistical models. Model #1 (null hypothesis, McNemar): probability correct to incorrect = probability of incorrect to correct = 0.5 or equivalent b=c. Model #2: probability correct to incorrect < probability of incorrect to correct or equivalent b > c. For model #2 we use maximum likelihood method and logistic regression to determine model parameters representing model 2. Statistical methods look different because each method reflects a different model.

AMM
  • 21
  • 2