9

I have a series of data points in this form (timestamp, lat, long) for a set of users. Each user has a trajectory when he travels from point A to point B. There might be any number of points from A to B. They are ordered data points based on time stamp. I want to transform them as a vector to do various analysis tasks. One thought I have is to look at turns and make them as a dimension. I would like to know more approaches. What I want is a one vector representing the whole trajectory, think of it like one point for a trajectory.Right now I have a collection of 3d points.

I would like to do trajectory similarity search. If there are two trajectories that in time are travelling close to each other then they are similar. Think of it like this you are going from house to work at 9am. Somebody else at 9:10 am also his home for work and stays some distance from you. Since u have the same workplace , you will most likely have same trajectory. Something like a classifier built on top of a trajectory. I can do activity detection in a trajectory, I can do a source destination analysis too.

StasK
  • 29,235
  • 2
  • 80
  • 165
gizgok
  • 569
  • 5
  • 9
  • 4
    Can you give an example of transformation to vector? From the mathematical point of view your data is already a collection of vectors in three dimensional space, clearly you want something else. So the example would be very welcome. – mpiktas Jul 02 '13 at 06:40
  • 1
    It's also important what kind of analysis is to be run. As a first step I would try a Karhunen-Loeve expansion on the (naively vectorized) paths anyway, that would "automatically" build the structure needed to capture path features. – Quartz Jul 02 '13 at 08:52
  • I'm afraid the edit doesn't respond to the comment by @Quartz, which asks for essential information: what kind of "various analysis tasks" do you contemplate? – whuber Jul 03 '13 at 16:06
  • @whuber Does the edit help? Let me know if I can give more informatiom. – gizgok Jul 05 '13 at 16:51
  • It's getting there. But what precisely do you mean by "similar"? An answer to that will suggest appropriate ways to encode the trajectories. – whuber Jul 05 '13 at 17:45
  • @whuber Added more description. Does this help? – gizgok Jul 06 '13 at 17:08
  • Yes: you are asking for how to measure closeness of curves in space-time. All the myriad solutions available in other dimensions (such as 2 and 3) are available to you, subject to a decision on your part concerning how to trade differences in time off against differences in location. (Actually, the same need for a choice of metric is apparent even when just comparing curves in 3D, because often elevation differences have a different meaning than horizontal differences.) Anyway, your concern is about *comparing* trajectories rather than *transforming* them. – whuber Jul 07 '13 at 12:27
  • @whuber If I can transform trajectories, I just want to see different kinds of exploration I can do and maybe get some interesting results. I do not know what they might be though – gizgok Jul 07 '13 at 20:42
  • I would also suggest to focus on comparison and a distance between vector valued time series. Implicitly such distance will act on both time and space, but mixing them in the input already might be confusing: then any distance would have to "know" that already and undo it. Unless you just want a very simple distance and have "the real thing" in the mapping, which means you're using a mapping to implicitly define a (two step) distance, which is also legitimate but must be done with care. – Quartz Jul 09 '13 at 10:19
  • Important preprocessing of the input trajectiories: shall the same geometrical curve traveled at differents speed patterns be considered the same? It seems so after the comment from @whuber. Then you might want first to factor out the travel pattern in time and get a curve parametrized by length. This allows for much simpler distances, such as the maximum spatial distance in the pair of points over each length. Also the K&L expansion is only interesting at that point. – Quartz Jul 09 '13 at 10:20
  • 1
    @Quartz The same geometrical curve traveled at different speed patterns is relevant to me – gizgok Jul 09 '13 at 16:07
  • 3
    possible duplicate of [Similarity measures between curves?](http://stats.stackexchange.com/questions/27861/similarity-measures-between-curves) – bdecaf Aug 22 '15 at 07:16
  • Global Alignment kernels can be useful for time-series classification. The underlying idea is to render the well-known DTW distance to a valid PSD kernel. With this kernel, SVM can do the learning and predictions. See http://citeseerx.ist.psu.edu/viewdoc/download?doi=10.1.1.388.5363&rep=rep1&type=pdf I've used for various time-series classification tasks and the results were good. – Vladislavs Dovgalecs Oct 26 '15 at 21:14

3 Answers3

1

I would start with dynamic time warping. As long as you have the distance between any two points (lat,long) this approach should work. It adjusts for different speeds of motion. For instance, you and I live in the same village and go to work to the same factory, but I stop by a coffee shop on the way. It takes longer for me to arrive but we're more or less on the same path, so the similarity measure adjusts for different time scales.

This is different from what you have in mind. It seems that you want to come up with one value (vector) to represent the trajectory, then calculate the distance between the vectors. I'm suggesting you to use the distance measure between the trajectories directly, without intermediate step.

Aksakal
  • 55,939
  • 5
  • 90
  • 176
0

For each user, you have two time series, lat(t) and long(t). I think that's the simplest representation -- I wouldn't try to complicate things by converting to some definition of turns, which would not only be more difficult, but also would require being very careful about the initial starting point and treating it differently in any analysis. (It's probably noisier as well.)

Keeping the data as lat & long time series also keeps it simple for the most likely use -- where you will look at a various time windows at different times - there's no need to constantly recalculate a starting point at the beginning of a new time window being analyzed.

If every users' time series lat & long were all sampled at the exact same times, as noted in another reply you can just concatenate the two time series vectors into one long vector. A similar example that had 5 time series looked like this:
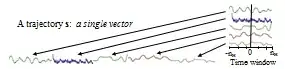
. Then you have one long vector for each user that you can analyze just like any other vector for pattern recognition, distance measures, clustering, etc.

For distance measures between users, you're typically going to use a weighted form depending on the application. For instance, when focusing on convergence towards a common destination, you'd increase the weights the most towards the end of the time window (whether looking at euclidean calculations, max distance, etc.).

But, the original question seems to say that there may be differing numbers of points between A and B for different users. And in any case, even for the same sampling interval, it's likely that that the times aren't exactly the same (maybe differing by some constant because sampling started at different times). Furthermore, it's quite possible that there will be some missing data. In any of these cases, conceptually, you'd need to think of each time series in continuous form, perhaps fitting a curve to it, and resampling every user at the exact same times. (That's analogous to the resampling that occurs in photo analysis when you shrink a picture). Then your time series vectors for lat & long are the same length and correspond exactly to the same times, so that the concatenated vectors for each user over some time period can be compared to each other correctly.

gms
  • 331
  • 2
  • 6
0

If you only consider instantaneous turns, i.e., changes in direction, I don't think this will uniquely define the position at a next time instance -- unless each user is travelling at a constant known speed (no indication of this in your question). Since you are moving across a (spherical, I infer?) surface, you will probably need at least a second coordinate to determine you positions uniquely. Why not simply build the $2 \times N$ array $[\bf{x}(t); \bf{y}(t)]$ per user with time stamp as a parameter, then concatenate this to a $1 \times (2N)$ vector $[\bf{x}(t) \bf{y}(t)]$ you must have a vector (or $1 \times (2N\times M)$ for $M$ tagged users? You could also take arc length $s(t)$ for the travelled path as a parameter instead. Are the time stamps at regular intervals; otherwise you will need a separate vector for them for look-up. PS: I cannot see a link with stats; is this relevant to Cross Validated?

Lucozade
  • 619
  • 1
  • 6
  • 7