Assuming a cross-classification like the one shown below (here, for a screening instrument)
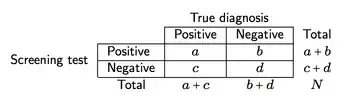
we can define four measures of screening accuracy and predictive power:
- Sensitivity (se), a/(a + c), i.e. the probability of the screen providing a positive result given that disease is present;
- Specificity (sp), d/(b + d), i.e. the probability of the screen providing a negative result given that disease is absent;
- Positive predictive value (PPV), a/(a+b), i.e. the probability of patients with positive test results who are correctly diagnosed (as positive);
- Negative predictive value (NPV), d/(c+d), i.e. the probability of patients with negative test results who are correctly diagnosed (as negative).
Each four measures are simple proportions computed from the observed data. A suitable statistical test would thus be a binomial (exact) test, which should be available in most statistical packages, or many online calculators. The tested hypothesis is whether the observed proportions significantly differ from 0.5 or not. I found, however, more interesting to provide confidence intervals rather than a single significance test, since it gives an information about the precision of measurement. Anyway, for reproducing the results you shown, you need to know the total margins of your two-way table (you only gave the PPV and NPV as %).
As an example, suppose that we observe the following data (the CAGE questionnaire is a screening questionnaire for alcohol):
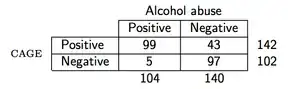
then in R the PPV would be computed as follows:
> binom.test(99, 142)

    Exact binomial test

data:  99 and 142
number of successes = 99, number of trials = 142, p-value = 2.958e-06
alternative hypothesis: true probability of success is not equal to 0.5
95 percent confidence interval:
 0.6145213 0.7714116
sample estimates:
probability of success
             0.6971831
If you are using SAS, then you can look at the Usage Note 24170: How can I estimate sensitivity, specificity, positive and negative predictive values, false positive and negative probabilities, and the likelihood ratios?.
To compute confidence intervals, the gaussian approximation, $p \pm 1.96 \times \sqrt{p(1-p)/n}$ (1.96 being the quantile of the standard normal distribution at $p=0.975$ or $1-\alpha/2$ with $\alpha=5$%), is used in practice, especially when the proportions are quite small or large (which is often the case here).
For further reference, you can look at
Newcombe, RG. Two-Sided Confidence
Intervals for the Single Proportion:
Comparison of Seven Methods.
Statistics in Medicine, 17, 857-872 (1998).