3

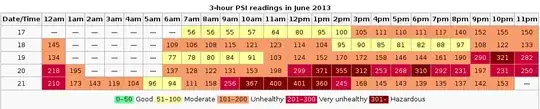
The table below is extracted from Wikipedia. It shows the Pollution Standards Index (PSI) readings of Singapore.

enter image description here

I am trying to estimate the four missing data points (2-5am) on day 20th June. I did this by first plotting a graph of the 3-hourly readings. Then I try to derive the 1-hourly readings with the formula:

PSI(1hrly)n = 3 * PSI(3hrly)n - PSI(1hrly)n-1 - PSI(1hrly)n-2

This derived data is then used to plot a graph of the 1-hourly readings. In theory, the 3-hourly curve functions like a moving average curve that lags the 1-hourly curve. There shouldn't be too much deviation. I tried a few values but I am getting wildly erratic results. The curve below is plotted based on values 200,200,140 and 200.

enter image description here

Is there a way to get a rough estimate of the missing data?

gung - Reinstate Monica
  • 132,789
  • 81
  • 357
  • 650
  • Perhaps some modifications to the answer [here](http://stats.stackexchange.com/q/67907/4485) may work. – Affine Oct 20 '13 at 02:16

1 Answers1

1

Short answer is that there are lots of ways to do it, ranging from any kind of interpolation you fancy (linear, cubic, cubic spline, piecewise cubic Hermite, ...) to something more statistical.

Time series modelling could range from any purely statistical model for the data as a single time series to something based on least in part on meteorological inputs. Personally, I would not want to try the former without much more data, and the latter surely requires expert input.

In principle, it is important to try different methods and check whether they agree.

Nick Cox
  • 48,377
  • 8
  • 110
  • 156