I am trying to automate a problem I usually solve by hand.
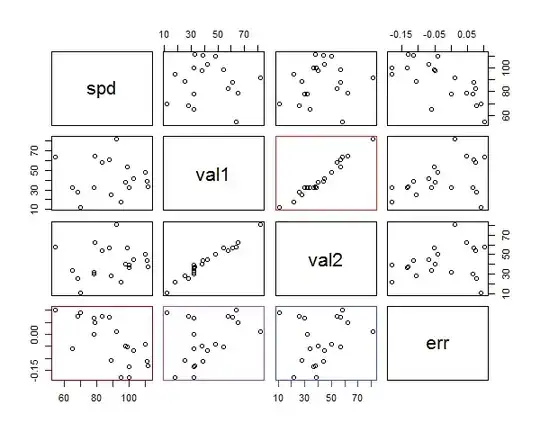
I have a sensor that collects data from the field. Every 6 months or so, I have to do a calibration on that sensor by collecting x data points. Using a calibrated device, I measure the same data measured by the field sensor and I have the following table:
    Field  | Actual
#   spd val val   err
1    89 25  28  -10.71%
2   100 32  39  -17.95%
3    54 64  58   10.34%
4    65 32  34   -5.88%
5    70 12  11    9.09%
6   100 32  37  -13.51%
7   110 48  50   -4.00%
8    78 32  32    0.00%
9    95 18  22  -18.18%
10   92 82  81    1.23%
11   78 32  30    6.67%
12   98 38  40   -5.00%
13  103 42  45   -6.67%
14   99 54  57   -5.26%
15   88 61  57    7.02%
16   79 65  62    4.84%
17   83 58  54    7.41%
18  111 39  44  -11.36%
19  112 33  38  -13.16%
20   68 28  26    7.69%
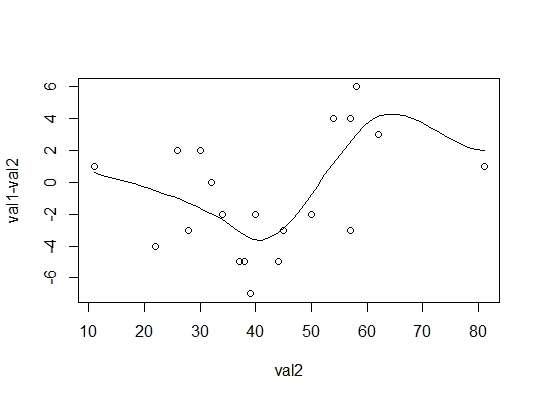
The following is the Error versus Speed plot:
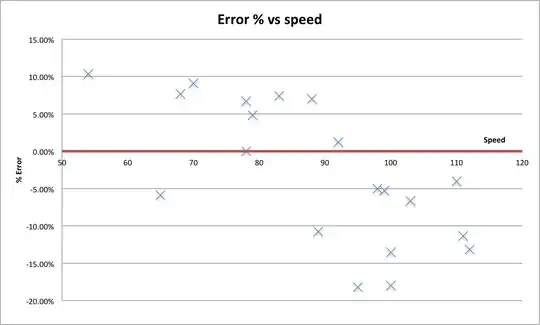
How I currently solve this problem:
- look at the data visually and determine how the data is "trending".
- I can split the data in x bins (depending on how new the sensor is, newer sensors can divide in to multiple bins)
- For the example above, I notice 3 bins:
- 50 to 70 - around 10% with one outlier
- 70 to 95 - around 3-4% with one outlier
- 95 to 120 - around -10% with one outlier.
- I then create the three bins for the sensor
- based on these bins, I determine a
fudgeorcorrectionfactor for each bin - I then retest the sensor for more counts and redraw the graph. and repeat the process
- this process is time consuming especially when I have 10 sensors to look after, and that process can take up to 3 hours to complete
Question:
How can I create a statistical or mathematical solution to aid me in solving my problem?
Edit 1:
Some clarification:
- Speed: speed as the object hits the sensor
- Value: read by the sensor
- Final result is to obtain an average error of less than 6% on all reads
- Sometimes I collect more than 20 reads
- I would like to have uniformly calibrated across all ranges of speed as in the difference between actual vs measured to be relatively consistent so that every measured value could be used without significant error
Edit 2:
- tools I have access to are Excel, Python, and R (in that order of usability for myself)
Edit 3:
- Each object that's hitting the sensor is different in shape, size, and speed, so therefore the object hitting at any speed is not related to the size of the object. The sensor as it gets older tends to reads values differently at different speed bins.
Edit 4:
- Based on @Glen_b 's answer, I created the following MS Excel file for non binned results:
http://97.107.136.148/results_stats_se.xls. Disregard thesteercolumns in the excel sheet. as it does not impact this problem.
Edit 5:
- I collected more data as shown below.
- Sub is a partial measurement of the object, so sub is part of the full_measurement.
- There is no ratio relationship between sub and full other than it's sub
Data:
Speed    Non Calibrated sensor        Calibrated sensor
Speed    Sub_1 Measurement_full    Sub_1    Measurement_full
sensor 1
  88     5500      51800            5610    49010
  95     5400      66000            5630    62700
sensor 2
  99     4700      34600           43100    35850
 103     5400      38200            5160    35360
  84     4900      47700            4550    48330
 101     5400      44800            5190    43050
 106     5200      28400            5290    24390
  96     4900      44900            4730    42900
 104     5300      35000            5350    35290
 102     5400      47700            5290    46810
  99     5500      35500            5270    34410
  89     5400      35600            5290    35490
  98     5300      39300            5240    37580
sensor 3
  93     5000      35600            4860    31050
  79     5500      41000            5130    37810
  92     4600      30700            4750    29720
  99     4900      47100            4820    46230
  94     5100      48300            4990    48230
  93     5300      51600            5460    54850
  99     5100      41700            4910    38960
  85     5100      42200            4960    42810
  81     5500      44100            5120    37960
  98     5600      64300            5550    62510
 102     5300      33400            5380    31220
sensor 4
 106     4800      35000            4430    30440
  99     5900      56300            5590    52740
  78     5900      56300            5730    54380
  96     6300      49100            5620    47790
  98     5500      42100            5340    38340
  70     5300      45700            4750    43670
  77     5100      37900            5100    34470
 106     4300      12100            3930     9750
 107     5800      35600            5270    28930
  90     3800      32300            3310    29390
  75     5800      62200            5490    61470
  88     4900      39200            5010    35720
sensor 5
 104     4500      44200            5000    45120
  95     5460      49400            5440    48520
 104     4700      33900            5210    33420
  86     5200      36400            5280    35140
  88     5000      49500            5760    52250
  94     5300      44400            5200    43310
  95     5200      54000            5370    54460
  99     5100      37000            5410    35600
  91     5600      62400            5540    61860
  95     5400      38000            5310    32510
  94     5100      49300            4990    46210
 101     4800      44300            5380    45130
 100     6600      23700            7500    24630
 105     5100      29200            5400    26740
  94     5500      42400            5730    40760
  89     5200      49600            5270    49570
  99     5300      47100            5700    47970
 100     4900      36600            5220    36790
  90     7200      25500            7340    23480
 100     5200      36500            5410    36210