There are two problems with your first approach: Multiple testing and the interpretation of the difference between significant and non-significant.
First, when you perform several tests, you increase the overall error rate. If you set $\alpha = .05$, you will still reject the null hypothesis 5% of the time when it is actually true (i.e. when there is no difference whatsoever). However, the probability that you reject the null hypothesis at least once when performing several tests is higher because you are taking this 5% risk each time you run a test. The problem is not very acute with only three tests but it still does not make much sense to run a test if you don't care about controlling the error level.
A quick fix for this problem is to adjust the error level with the Bonferroni correction. Since it is based on a very general probability inequality, it doesn't matter what the tests are and you can always use it but you will loose power. For example, it's possible that, after applying the correction, none of your tests would be significant and you would be back to the results of your second approach. This would resolve the apparent inconsistency but would not be terribly useful. Generally speaking, the main problem with this technique is that yo are not using all the information you have and the correction is usually too conservative. That's one reason to choose an ANOVA approach when you have several groups.
The second problem is that the difference between significant and non-significant is not necessarily itself significant. If you rejected the null hypothesis that model 1 is equal to baseline but not the separate hypothesis that model 2 is different from baseline, you still haven't established that model 1 is different from model 2. Those are three different questions. Let's see how this could happen:
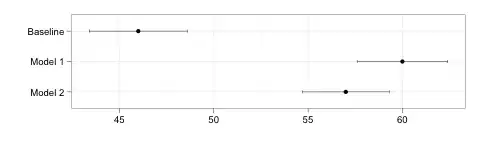
Now, let's imagine that the difference between baseline and model 1 is “barely” significant, say p = .04. The p-value from a test of the difference between baseline and model 2 would then be a little over the threshold, say p = .06, so not significant. Yet, at the same time, model 1 and model 2 appear very similar and the difference between the two is also obviously not significantly different from 0.
The thing is that the logic of statistical testing requires us to specify an error level but there is nothing exceptional about this threshold. We simply have a little less evidence than the score for model 2 is higher than baseline and maybe this evidence is not sufficient to rule out the null hypothesis at the specified error level. This is however not enough to conclude that it is different from model 1.
Ignoring the multiple testing issue, you could then conclude that you don't know if model 2 is in fact better or worse than baseline and you certainly don't know if it is better or worse than model 1. Intuitively, if your data indeed look like the data on the graph, I don't find this very satisfying because it means treating model 1 and model 2 differently based on evidence that is much thinner than the evidence that model 2 is in fact better than baseline. However, this type of thinking is quite different from the logic underlying statistical tests. Instead of blindly make binary decisions based on the tests, I would therefore rather look at some graphs and make a judgment call about the results.
Either way, the results you presented suggest that your models do in fact represent an improvement over the baseline but there is no way you can conclude that model 1 is better than model 2. This is also pretty much what you can conclude from the ANOVA. If you want to know more, you need to look carefully at the size of the difference and probably collect more data/test the models on a larger data set.
PS: All this ignores two potential additional problems that were not raised in the question, namely the nature of your response variable (is it a proportion?) and independence (are all the models tested on the same exemplars?) Depending on the answers to these questions, ANOVA/T-test might not be the best choice anyway (see also this previous question). Also, if you specifically want to compare each group to baseline, you can also achieve that in an ANOVA framework by using contrasts. You would have a theoretically sound approach with more power than post-hoc pairwise tests but still would not address the “which one is best” question.