4

Mboxcox in Stata suggests transforming my variables using a power of 0.1 for the independent variable, and 0.4 for the dependent variable.

I have run the model, and it fixes problems associated with the assumptions of OLS. But certainly, it complicates matters in terms of interpretations.

Please outline possible interpretations and solutions.

Dependent variable is in millions of dollars, and independent variables are number of years. and a number of dummies which do not require transformation.

Cesare Camestre
  • 699
  • 3
  • 15
  • 28
  • Why would you need to transform your independent variable? – Glen_b May 30 '13 at 13:51
  • 2
    If you carefully read [the article](http://www.stata-journal.com/sjpdf.html?articlenum=st0184) on which this code is based, you will find this key bit of advice: "Following the advice of Sheather (2009), we round the suggested powers to the *closest interpretable fractions*" (emphasis added). For many people, those would be the "fractions" $0$ (in place of $0.1$) and $1/2$ (or possibly $1/3$, in place of $0.4$). Some might even round $0.4$ to $0$ or $1$. *You* need to select the rounding based on the possible interpretations and what any underlying theory suggests. – whuber May 30 '13 at 15:49
  • 1
    @glen_b One excellent reason to transform the independent variable is explained and illustrated (with an example) [here](http://stats.stackexchange.com/questions/35711/box-cox-like-transformation-for-independent-variables/35717#35717). – whuber May 30 '13 at 15:51
  • 2
    @whuber Thanks; indeed I am aware of that as a reason to do so (and do so transform sometimes, for that reason). I wondered why the OP in particular was doing it (hoping it was something like that, but considering the possibility that they might instead have thought IVs need to have a normal distribution). – Glen_b May 30 '13 at 16:05
  • 1
    I'd definitely support @whuber's mention of the advice of Sheather for rounding the values (indeed, Sheather's advice is often worth considering); Nick Cox's answer below says essentially the same thing. I'd also suggest looking at Tukey's discussion of his 'ladder of powers' for similar advice about taking interpretable round numbers. – Glen_b May 30 '13 at 16:10
  • Rounding to 0 doesn't make much sense! I would end up with everything 1! – Cesare Camestre May 30 '13 at 19:17
  • If so, the implication is beautifully simple and clear: no transformations are required. – Nick Cox May 30 '13 at 19:40
  • 4
    A Box-Cox parameter of zero corresponds to the *logarithm,* not the zero power. It sounds like you would benefit from reading some more background about this technique before proceeding further. – whuber May 30 '13 at 19:45
  • I am quite sure a transformation is needed, because I have issues with the assumptions of the regression model. Using logs, seem to solve most problems apart from normal distribution, but some questioned adding a constant (such as 1) in view that one of the variables is age.. – Cesare Camestre May 30 '13 at 19:49
  • Ok - agreed but then I have age.. and i was criticised for proposing taking ln(age+1). – Cesare Camestre May 30 '13 at 21:01
  • @Glen_b "they might instead have thought IVs need to have a normal distribution" Is it a statistical issue for IVs to have a non-normal distribution? And if not, why? Being a parametric procedure, I was lead to believe that this is among the basic requirements. – landroni Mar 06 '14 at 14:28
  • 2
    @landroni Since we condition on the IVs in ordinary regression, there's no distributional assumption *whatever* on them. Indeed, there's not even any unconditional distributional assumption on the DV itself (i.e. looking at a histogram or QQ plot etc of the DV is no use, since we make no particular assumption about that). *If* one is doing the usual normal-theory inference (hypothesis tests, CIs, PIs), there's an assumption about the distribution of the error term, which is assessed by residual diagnostics. This is discussed in comments or answers on dozens of questions here by various people. – Glen_b Mar 06 '14 at 21:24
  • 1
    @landroni Even then, the normality assumption may not be particularly crucial; in large samples it's usually only much of an issue for prediction intervals. (In small samples it matters much more.) – Glen_b Mar 06 '14 at 21:29
  • @Glen_b Thanks for the explanations. I find all this curious as I've read conflicting arguments in different sources (although most likely it's just me who is confusing things up!). I'm currently reading through the reams of comments on these issues throughout the site, and will come back with a separate question if I'm still unconvinced. – landroni Mar 06 '14 at 21:38
  • 1
    @landroni A list of the assumptions is [here](http://stats.stackexchange.com/questions/86830/transformation-to-normality-of-the-dependent-variable-in-multiple-regression/86846#86846) (the list can vary somewhat because people can add or remove things at the periphery which may not be explicitly used in the derivations; the core assumptions don't change). If you'd like to discuss it some more, we can take it to [chat](http://chat.stackexchange.com/rooms/18/ten-fold) – Glen_b Mar 06 '14 at 22:02
  • @Glen_b Thanks for the link, and for the chat invitation! I'll try to first properly do my homework before taking up that. :) – landroni Mar 06 '14 at 22:37
  • @Glen_b This question has excellent answers on the issue of normality: [What if residuals are normally distributed, but y is not?](http://stats.stackexchange.com/questions/12262/what-if-residuals-are-normally-distributed-but-y-is-not). – landroni Mar 07 '14 at 14:54

2 Answers2

11

In my experience, likelihood methods for finding Box-Cox transformations of data are both poor (in performance) and unstable. They are contrary to the spirit and intended use of transformations, too, which include:

  • Finding interpretable re-expressions of data,

  • Attempting to linearize relationships,

  • Attempting to achieve homoscedastic relationships,

  • Allowing interactive exploration of data analysis options,

  • Using calculations that are resistant to outlying values, and

  • Being robust to alternative (but plausible) assumptions about data behavior.

Instead, by its very nature, a likelihood-based method (such as mboxcox, which aims to achieve [approximate] multinormality), violates all these aims, as you can check, one-by-one.

Nevertheless, almost since the time Box-Cox transformations were first described, people have been coming up with automated ways to estimate them. Few work well, but many sometimes give an approximate starting point, or range of starting points, to streamline the exploration.

Before we go on, let's establish the correct use of mboxcox. A careful reading of the article on which this code is based find this important suggestion: "Following the advice of Sheather (2009), we round the suggested powers to the closest interpretable fractions" (emphasis added). Traditionally, an "interpretable fraction" [sic] is a value that might appear in a physical theory: $1/2$, $1/3$ (and their negatives) along with whole values $0, 1, 2$ (and their negatives). Thus it was never intended that the user accept the output of mboxcox as-is: it has to be rounded according to knowledge of the data and the objectives of the analysis.


As a quick test of mboxcox, I applied it to the classical Mercury vapor pressure dataset popularized by John Tukey. It is the simplest multivariate dataset possible, containing $19$ (temperature, pressure) pairs with extremely small errors, leading to little uncertainty in what the best Box-Cox parameters ought to be. An exploratory data analysis (EDA) of this dataset is described in my answer at Box-Cox like transformation for independent variables?. It finds, correctly, that (after converting temperature to absolute temperature) the Box-Cox powers should be $0$ for the pressure and $-1$ for the temperature. (In this case, unlike in most data analyses, there is a correct answer given by a well-known physical law. That is why it makes a fine proving ground for any automated procedure.)

By contrast, when we apply mboxcox, at first it complains that it cannot deal with the zero temperature. If we simply exclude it--it will later found to be an outlier, anyway--it reports that the Box-Cox parameter for pressure should be $0.3420578$ (comfortably close to the convenient $1/3$, with a $95$% CI from $0.22$ to $0.46$) and for temperature should be $2.2386$ (CI from $1.5$ to $3.0$), which could be taken as close to $2$. Good, right? Both are highly significant.

Figure 1

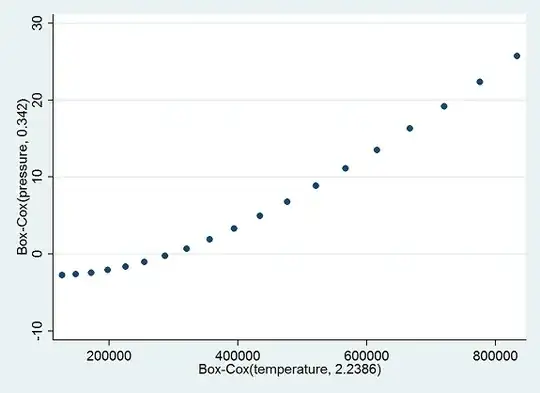
But, as we know--and can see in the nonlinear trend in the scatterplot--these are awful results, because we really need to be using the absolute temperature. Let's start over after adding $273$ degrees to the temperatures. Because there will no longer be a problem with zero, we will include all the data. This time mboxcox reports that the Box-Cox parameters should be $0.0712114$ for pressure and $0.2411739$ for temperature (CI from $-0.8$ to $1.3$). Even after rounding both values and accounting for the long confidence interval for temperature, the results are far from correct--even though the $R^2$ value in the resulting regression of (transformed) pressure on (transformed) temperature actually exceeds what is achieved when the correct parameters are used!

Figure 2

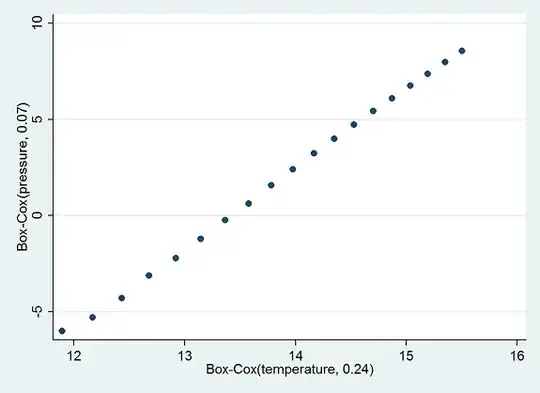
Although this is a beautifully linear relationship on this scale, examination of the residuals shows it leaves much to be desired.

Residuals

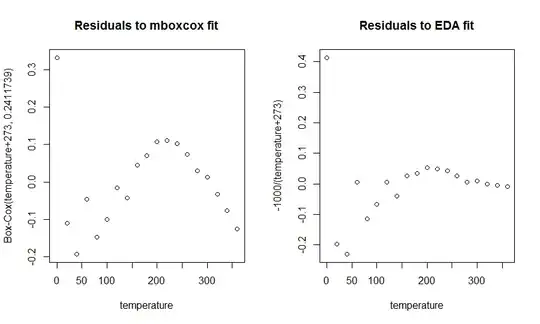
NB: The y-axes on these plots are not directly comparable, because they represent different re-expressions of the pressures. What is of concern are the apparent patterns of non-linear behavior and serial correlation in each plot. The right plot does a better job at identifying the outlier (at a temperature of 0) and is much more horizontal than the left plot (mboxcox), which shows a clear curvilinear trend and is nowhere horizontal.

If we remove the case with the lowest temperature (which is the main source of the difficulty, even though it's not much of an outlier), mboxcox finally gets it right: it estimates a parameter of $0.013$ for pressure, which clearly rounds to $0$, and $-0.8559$ for temperature (CI from $-1.4$ to $-0.3$), which anyone would round to $-1$, with a possible $-1/2$ contained in the confidence interval. But it took three tries and required an insight (the use of absolute temperatures) that dropped out of the original EDA but had to be supplied by the analyst using mboxcox.

With the results of this quick look we may deduce that mboxcox indeed has the potential to deliver useful starting points for an EDA of multivariate data, provided it is carefully protected by first identifying outliers, that the estimates are appropriately rounded, and that the data are further explored to make sure that other Box-Cox parameters (even those far from the "optimal" ones) might not serve better. I would give little weight or credence to the mboxcox results without extensive follow-on analysis, because although it aims at establishing an approximate multivariate normal distribution of the data, that does little to assure either linearity or homoscedasticity and likely places too much emphasis on transforming the independent variables instead of the dependent variable itself.

kjetil b halvorsen
  • 63,378
  • 26
  • 142
  • 467
whuber
  • 281,159
  • 54
  • 637
  • 1,101
  • 6
    Excellent answer. I'd underline that identifying a good functional form for the relationship between variables is widely underestimated in importance, while being right about the distribution of errors is widely overestimated. – Nick Cox May 30 '13 at 17:15
  • 1
    Thanks @Nick. I'm actually expecting comments and debate about what makes the result of an EDA "correct." The example here is interesting in that *if we had no prior theory to guide us,* it would be much tougher to decide whether to reject the second `mboxcox` result: it hinges on a somewhat delicate assessment of the residuals. In practice, especially with sociodemographic and biological data, different analysts using different procedures can legitimately arrive at equally valid but strikingly different ways of expressing the variables, leading to different functional forms. – whuber May 30 '13 at 17:27
  • I do not have issues with linearity and homoscedasticity, only with the normality if I adopt a log-linear model (and ignore the mboxcox approach), but then an issue arose because of age.. and age of firm could be 0. – Cesare Camestre May 30 '13 at 19:31
  • 2
    You question indicates the contrary: since `mboxcox` returned *different* values of the parameter for the DV and IV, it sounds like you *do* have an issue with linearity; and because the value it returned for the DV differs substantially from $1$, you *do* have an issue with homoscedasticity! Moreover, it would be rare to have any reason to want regression data to be normal; this is neither expected nor assumed of standard regression techniques. The presence of a zero in your data also indicates you will have problems with `mboxcox`, as my own experience attests. – whuber May 30 '13 at 19:37
  • In the initial data, you are correct there are issues with linearity, and homoskedasticity. These could be fixed using logs: ln(investment) = ln(age+1) + d1 + d2 + d2.. which seems to be a suitable transformation (solves most problems) but this model does not solve (a) normal distribution problems (it is negatively skewed) (b) there is an issue with adding a constant to the ln(age), BUT this has to be done because age can be 0. So I went back to original data, and tried to use mboxcox, to see if there is a beter alternative and came up with those strange powers I mentioned previously. – Cesare Camestre May 30 '13 at 20:19
  • 1
    That's a good start. (Experience and some theory suggest automatically taking the log of investment and then considering using the *square root* of the age, should that be necessary.) But *what* is negatively skewed? Log(investment) or their *residuals*? [Only the latter matters, not the former](http://stats.stackexchange.com/questions/60410). As far as adding 1 to age goes, there are [several good threads here](http://stats.stackexchange.com/search?q=log+add+regression) discussing this issue, but this won't be an issue if you use the root of age or don't transform it at all. – whuber May 30 '13 at 21:22
  • The residuals are slightly negatively skewed (-0.7) after applying the log to the investment – Cesare Camestre May 30 '13 at 21:41
  • The values you get after applying the log are *not* the residuals: the residuals are the differences between the logs and the fitted values in your linear model. – whuber May 30 '13 at 21:41
  • Whuber you are right, but I'm applying a Shapiro-Wilk test on THE RESIDUALS. – Cesare Camestre Jun 05 '13 at 13:58
  • I tried using log of investment and the root of age- this way I still do not get normal distribution. – Cesare Camestre Jun 05 '13 at 14:12
  • @whuber "Moreover, it would be rare to have any reason to want regression data to be normal; this is neither expected nor assumed of standard regression techniques." I'm no expert, but I am surprised. Being a parametric procedure, I was lead to believe that normality of the underlying data was among the basic requirements of OLS. Is it not? – landroni Mar 06 '14 at 15:24
  • 2
    @landroni The distinction being made is between the *data* (the response values) and their *residuals*. Some regression techniques make parametric assumptions about the distributions of the residuals. It is rare that additional assumptions are made about the response itself: its distribution is determined by the explanatory variables and the distributions of the residuals. – whuber Mar 06 '14 at 23:11
  • @whuber Thanks for the explanation. Very curious to learn that what matters is the distribution of the response conditional on the IVs. What about the IVs themselves? No distributional assumptions on them, either? – landroni Mar 07 '14 at 07:31
  • 2
    @landroni Not for fixed-effects models: they do not assume the IVs are random variables at all. – whuber Mar 07 '14 at 13:54
  • @whuber This question has excellent answers on the issue of normality: [What if residuals are normally distributed, but y is not?](http://stats.stackexchange.com/questions/12262/what-if-residuals-are-normally-distributed-but-y-is-not). – landroni Mar 07 '14 at 14:51
  • @landroni Thank you. This is a FAQ and is discussed (I suspect) in several hundred threads and at least as many comments. – whuber Mar 07 '14 at 14:53
6

Although you have given some details, this is too close to "I have some data, want to fit a regression, and can't interpret my model easily" to allow much to be said easily that is likely to be really helpful. Too much depends on what your field is, what models make sense or are interesting substantively in that field, etc., not to mention finer details of your data. Not least, what is "interpretation"? It can mean anything from "I don't understand the statistics here, so need technical explanation on my level" to "What does this imply in subject-matter terms?".

But (personal opinions mixed in here)

  • If your response or dependent variable is a count, I would expect Poisson regression to make much more sense than regression. Even if it is a measured number of years that is zero upwards, I would still expect that. http://blog.stata.com/tag/poisson-regression/ is one account rich in Stata context.

  • The idea of Box-Cox is letting your data indicate which transformations make most sense. However, Box-Cox like much else is a knife that you can cut yourself with. The original examples are instructive: Box and Cox didn't use the precise powers indicated, but logarithm and reciprocal, which made sense on other grounds. Unless you are fitting a power law, it is usually more practical to regard Box-Cox as pointing to one of a small number of standard transformations, most commonly log, root or reciprocal. It is rare that (say) powers such as 0.4 can be related to substantive literature unless there is good theory underpinning the use of fractional powers in the first place. The fact that most common transformations can be regarded as members of a family doesn't mean that all members of that family are equally helpful.

Nick Cox
  • 48,377
  • 8
  • 110
  • 156
  • I do not have a count in the independent variable. As I said, its millions of pounds, and therefore I would not use poisson regression. Counts are in the dependent variables, and previously I was told that when that happens there is no case to use poisson regression. – Cesare Camestre May 30 '13 at 19:22
  • 2
    Sorry, my ambiguity, which I have fixed in an edit. I was referring to your response (dependent variable). (I did say "number of years".) Contrary to your assertion, counts as response are the canonical case for Poisson regression. – Nick Cox May 30 '13 at 19:29
  • 1
    There's confusion here, Nick, but it's not your fault: the question *still* states the DV is "number of years," which is manifestly not a count, it's a *duration.* – whuber May 30 '13 at 19:44
  • @IdiotAbroad You are telling us currently that your dependent variable is a count. But on checking your post again, I see that you refer to several dependent variables. Are you confusing dependent (conventionally $y$) and independent variables (conventionally $x$)? – Nick Cox May 30 '13 at 19:49
  • Sorry - I do apologise. I cannot concentrate right now. My regression is investment = age + d1 + d2 + d3 etc – Cesare Camestre May 30 '13 at 19:58
  • The dependent variable is not a count! – Cesare Camestre May 30 '13 at 20:06
  • Whuber, i fixed the question - apologies, I have mixed the terms when I actually wrote the question; and only realised just now! – Cesare Camestre May 30 '13 at 20:11