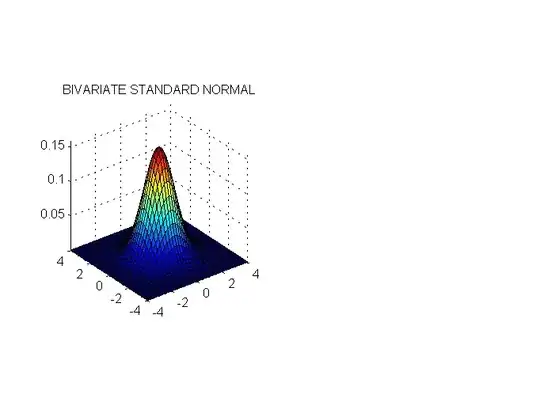
I used the MATLAB code written below to create the following probability density function. It creates the familiar hill-shaped distribution.
I'm interested to see (whether via MATLAB code or just an linked image) a PDF plot of a distribution that is univariate normal but is multivariate platykurtic or multivariate leptokurtic. Failing that, I would like to read a description of how my image would like different if it was univariate normal but is multivariate platykurtic or multivariate leptokurtic. At present I cannot visualize what that would look like.
MATLAB code:
function prob = csevalnorm(x,mu,cov_mat);
[n,d] = size(x);
% center the data points
x = x-ones(n,1)*mu;
a = (2*pi)^(d/2)*sqrt(det(cov_mat));
arg = diag(x*inv(cov_mat)*x');
prob = exp((-.5)*arg);
prob = prob/a;

% Get the mean and covariance.
mu = zeros(1,2);
cov_mat = eye(2);% Identity matrix
% Get the domain.
% Should range (-4,4) in both directions.
[x,y] = meshgrid(-4:.2:4,-4:.2:4);
% Reshape into the proper format for the function.
X = [x(:),y(:)];
Z = csevalnorm(X,mu,cov_mat);
% Now reshape the matrix for plotting.
z = reshape(Z,size(x));
subplot(1,2,1) % plot the surface
surf(x,y,z),axis square, axis tight
title('BIVARIATE STANDARD NORMAL')