I have a sample of 608 subjects and I need to remove outliers for age. In R, the boxplot appears like this:
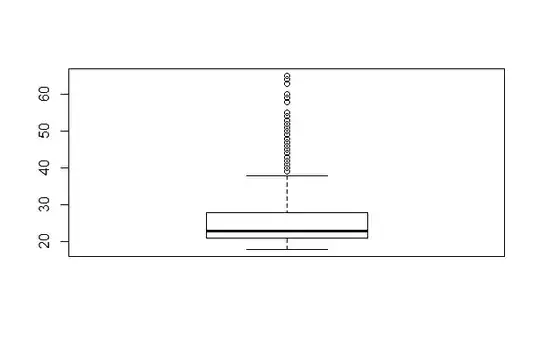
It shows 74 outliers:
> length(boxplot(mydata)$out)
[1] 74
After I have removed these outliers, should I take a new look at the boxplot with the new data? If I do that, the boxplot still contains other outliers:
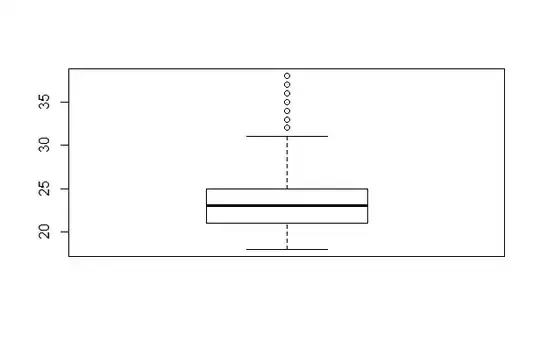
Questions:
1. Is this a problem?
2. Is this method appropriate for removing outliers for age?
EDIT: I will not use age as a variable in a regression model. I want just to remove outliers for age in order to obtain a more uniform sample (this is a students sample). For example, I have one subject 60 years old, while the mean age of my sample is 26.6. For this reason, I was also thinking to remove outliers not by boxplot but by ± 3 standard deviations from the mean. From my sample, I then will select two groups of subjects for further testing.