Background
I have a model with 17 parameters, and I currently use the coefficient of variation ($\text{CV}=\sigma/\mu$) to summarize the prior and posterior distributions of each parameter.
All of the parameters are > 0. I would also like to summarize these pdfs on a normalized scale (in this case standard deviation normalized by the mean) so that they can be compared to each other, and with other statistics presented in similar adjacent plots (sensitivity, explained variance). I will include density plots for each parameter separately, but I would like to summarize them here.
However, the sensitivity of the CV to $\mu$ causes the following confusion that, although easily explained in text, would be preferable to avoid.
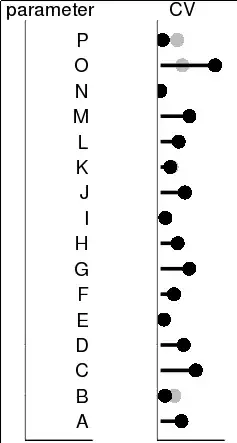
- the posterior CV of one parameter is greater than the prior because the mean has decreased more than the variance (parameter
Oin figure). - one of the parameters (
N) is in units of temperature. It has a 95% prior CI of (8,12 Celsius $\simeq$ 281-285K); when I present the data in units of Kelvin which is only defined for positive values, the CV is <1%, if presented as C, the CV is closer to 40%. To me, it seems that neither of these CVs provides an intuitive representation of the CI.
Question
Are there better ways to present this information, either as a CV or as another statistic?
Figure
As an example, this is the type of plot that I am planning to present, with posterior CV in black and prior CV in grey. For scale, the CV of parameter O is 1.6.