Suppose the ages of $n_1=20$ randomly sampled subjects who drink are
$X_i \sim\mathsf{Norm}(\mu = 40, \sigma=7),$ rounded to the next lower year. Independently, suppose ages of $n_2=25$ randomly sample subjects
who abstain are $Y_i \sim\mathsf{Norm}(\mu = 30, \sigma=5),$ similarly rounded. Then your data might be similar to the fictitious data
sampled in R below:
set.seed(2022)
x = floor(rnorm(20, 40, 7))
y = floor(rnorm(25, 30, 5))
Of course, in a real study, you would not know the population
mean and variances. But from the data you could find summary statistics as shown below. This gives the impression that drinkers
are often older than abstainers.
summary(x);  length(x);  sd(x)
   Min. 1st Qu.  Median    Mean 3rd Qu.    Max.
  19.70   33.29   39.07   38.05   42.77   47.14

[1] 20         # size of first sample
[1] 7.002077   # SD of first sample

summary(y)  length(y);  sd(y)
   Min. 1st Qu.  Median    Mean 3rd Qu.    Max.
  22.21   28.26   30.59   30.15   33.25   36.06
[1] 25
[1] 3.948933
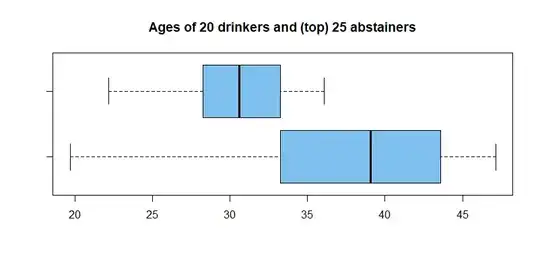
Boxplots (x on bottom) of the two samples are as follows. There are not signs of severe skewness or of many oultiers, so we believe
the data are roughly normal. It seems appropriate to do a Welch two-sample t test (which does not assume equal variances) to see if
the difference between $\bar X = 38.05$ and $\bar X = 30.15$ is
statistcally significant at the 5% level.
hdr="Ages of 20 drinkers and (top) 25 abstainers"
boxplot(x,y, horizontal=T, col="skyblue2", main=hdr)
A printout from t.test in R for these two samples is shown below.
The P-value $0.0001 < 0.05 = 5\%$ shows that the null hypothesis
is rejected.
t.test(x, y)

        Welch Two Sample t-test

data:  x and y
t = 4.5042, df = 28.441, p-value = 0.0001042
alternative hypothesis:
 true difference in means is not equal to 0
95 percent confidence interval:
  4.309023 11.488299
sample estimates:
mean of x mean of y
 38.05252  30.15386
Of course, your real data might show a difference in the other
direction of nor significant difference at all, but the procedures
would be the same for nearly-normal data.
A95% confidence interval for difference between the ages of drinkers and abstainers is given in the output above as $(4.3,\, 11.5).$
