I read the posts here and here.
The real-life problem is: In a rare event simulation catastrophic events occur extremely seldom. The performance of my underlying system has an unknown distribution and gets poor only in these rare events.
I want to estimate the distribution of my system performance using a rare event simulation.
To explain things see the following two curves.
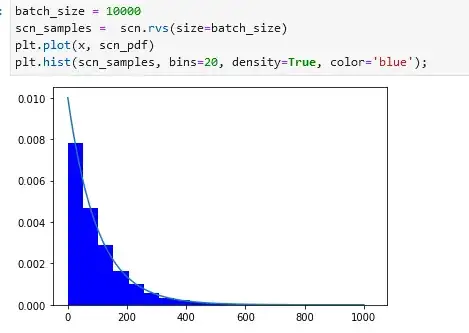
The blue line shows the distribution of scenarios. There are very common scenarios and there are rare scenarios and if I run my simulation I get scenarios according to this blue distribution. The orange curve describes the performance of my system. Only in the rare events the criticality rises and leads to catastrophic outcomes.
I would consider myself beginner/intermediate when it comes to applied statistics. What I want to to: I want to fit samples from a long-tail distribution but the samples have been modified by an unknown second distribution.
In my simulation I draw samples from the blue distribution and calculate the outcome of my system using the CDF of the orange curve.
As expected the sample distribution is an extremely screwed version of the original blue distribution. My task is to derive the original orange distribution from the sample distribution.
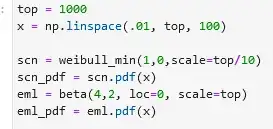
I know that if I apply a log() to my samples the results resembles the original orange curve quite well but completely destroys my mean and variance. This is where I am stuck atm. Can you please help? To simplify things a little I give you the actual distributions. In real-life these are unknown and have to be assumed or regressed.
Question: How can I derive the parameters of the orange curve only by using the samples and some model assumptions regarding the original distributions.


