Suppose you have a data set that doesn't appear to be normal when its distribution is first plotted (e.g., it's qqplot is curved). If after some kind of transformation is applied (e.g., log, square root, etc.) it seems to follow normality (e.g., qqplot is more straight), does that mean that the dataset was actually normal in the first place and just needed to be transformed properly, or is that an incorrect assumption to make?
- 103
- 4
- 579
- 2
- 16
-
10I'd say it means that the _transformed data_ are approximately normal, not the original data. – BruceET Feb 28 '22 at 19:31
-
12*Nonlinear* functions like logs and roots are usually not considered to be "scaling." The latter term is conventionally reserved for linear changes only: that is, multiplication by a constant followed by adding another constant. The phrase "actually normal" is quite interesting, because there is a philosophy of data analysis that says not to let the form in which the data are expressed determine how you express them for analysis. From this perspective, such data very well might be conceived of as "actually normal" values that were given to us in the form of the exponentials or squares, *e.g.* – whuber Feb 28 '22 at 19:55
-
@whuber why aren't they considered to be scaling exactly? I thought that the monotinicity of the log function is what makes it suitable for scaling. – mesllo Feb 28 '22 at 23:12
-
8I suspect different communities might have different concepts of "scaling" in various contexts, but overall, this term generally is used in math and stats to refer to a proportionate change in size ("scale"), often with the option to change the origin of a unit of measurement. Thus, some effort is usually made to distinguish the kinds of non-linear *transformations* or *re-expressions* you mention from mere "scaling." It's a useful distinction. – whuber Feb 28 '22 at 23:45
-
2Any random variable with a continuous distribution on $\mathbb R$ can be transformed monotonically into any other distribution (with a minor caveat about values which combined have probability $0$ of occurring). That does not mean they have the same distribution – Henry Mar 02 '22 at 14:16
-
@whuber I think scaling also implies that the number being multiplied by is positive. And I'm not sure that centering is included in scaling. – Acccumulation Mar 02 '22 at 19:35
-
@Acccumulation Yes, usually "scaling" refers to multiplication only. But it's unnecessary, somewhat artificial, and accomplishes little, to limit the scale factor to positive numbers. In other mathematical settings the restriction to positive numbers can make sense, such as scaling distances (negative values cannot be distances). – whuber Mar 02 '22 at 19:40
3 Answers
NO
It means that the transformed distribution is normal. Depending on the transformation, it might suggest a lack of normality of the original distribution. For instance, if a log-transformed distribution is normal, then the original distribution was log-normal, which certainly is not normal.
- 28,473
- 4
- 52
- 104
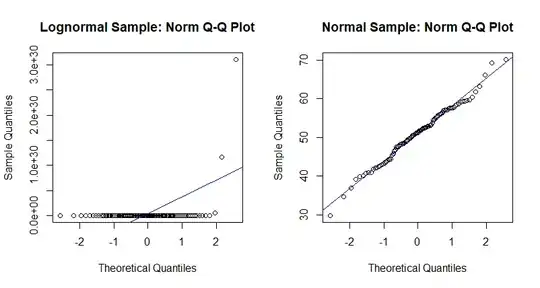
_Comment continued: Consider lognormal data x, which does become
exactly normal when transformed by taking logs. In this case (with $n=1000),$
Q-Q plots and the Shiapiro-Wilk normality test agree for original and transformed data.
set.seed(2022)
x = rlnorm(100, 50, 7)
y = log(x)
par(mfrow = c(1,2))
 hdr1 = "Lognormal Sample: Norm Q-Q Plot"
 qqnorm(x, main=hdr1)
  abline(a=mean(x),  b=sd(x), col="blue")
 hdr2 = "Normal Sample: Norm Q-Q Plot"
 qqnorm(y, main=hdr2)
  abline(a=mean(y), b=sd(y), col="blue")
par(mfrow = c(1,1))
shapiro.test(x)

        Shapiro-Wilk normality test

data:  x
W = 0.1143, p-value < 2.2e-16     # Normality strongly rejected

shapiro.test(y)

        Shapiro-Wilk normality test

data:  y
W = 0.99017, p-value = 0.678     # Does not rejece null hyp: normal
- 47,896
- 2
- 28
- 76
In general, the answer is no. It will be normal only if it was generated by the back transformation that corresponds to your (series of) transformations (see edit below). Nevertheless, there are good chances that the distribution of the transformed data is approximately normal, but keep in mind that not every bell-shaped distribution is a normal distribution. You need more than eye bowling before you start your analyses.
Edit regarding the first sentence in my answer: the transformation must be monotonic. For example, if you take data that was generated by a normal distribution, square it and then apply square root - you will not end with a normal distribution.
- 39
- 6
-
In practice, your second paragraph itself needs a pedantic qualifier. For example, human heights are often regarded as approximately normal, but squaring and then square rooting -- although a silly thing to do -- would get you back where you started, and the same applies whenever all the data are positive. What you have in mind, no doubt, is that the support of a normal distribution is the entire real line, so there is always some fraction of the probability for negative values, and then in principle there is the difficulty you allude to. – Nick Cox Mar 04 '22 at 08:02
