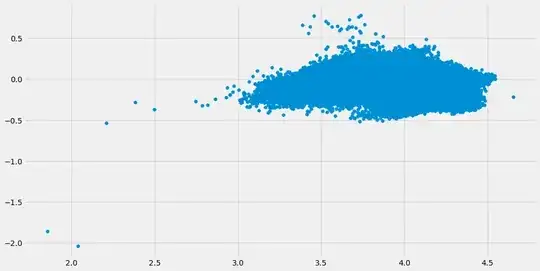
I have a dataset with 10 variables. A couple of them are "Customers" and "Sales". I want to find what is the increase in sales with a unit increase in customers. That is, I want to find the parameter for the "Customers" variable in a simple linear regression model with "Customers" as predictor and "Sales" as the target variable. The dataset has more than 1m observations. The relationship between both the variables look like the following;
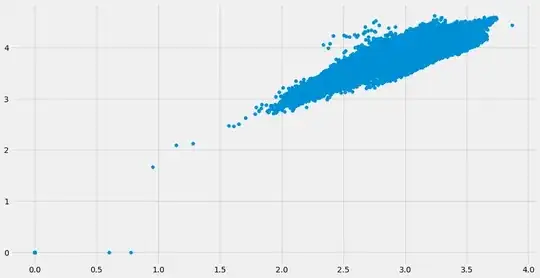
Now, there's a clear indication of heteroscedasticity in the plot. Considering the range of values that have been given in the variables (0-7K for "Customers" and 0-40K for "Sales"), I re-expressed both the variables with log transformation. The same scatterplot now looked like the following;
The latter looked more captivating, so I fitted the log re-expressions instead of the raw data in the model (OLS). Of course I got a parameter for the predictor. But upon plotting the fitted values against the "residuals", I begot the following plot;
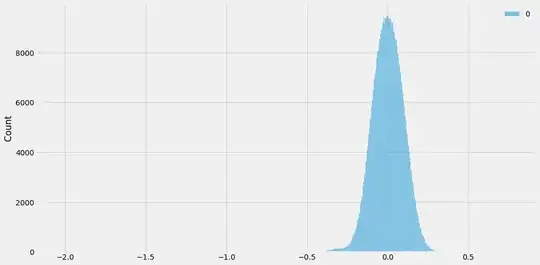
I frowned at it more than twice and examined the distribution of the residuals instead. I got - for the same model;
I realized that there's a count in the variables that is in great many a no. I found that that almost 17% of the data in both the variables are 0s. When no. of customers is 0, sales is 0 too. I removed all the zeroes from the "Customers" variable and fitted the same model - OLS using log of both the variables. The fitted vs residual plot and the distribution of the residuals now look like the following;
The residuals - resembling Stewie Griffin's head look reasonably homoscedastic (as @Glen_b suggests in this answer). It's distribution - a matter of "least importance" - too is normally distributed.
However, I'm now stuck with a few fundamental questions, which are as follows;
1. Is my approach correct? I wanted to answer the question; "what is the increase in sales with a unit increase in customers". In order to that, I realized that heteroscedastic residuals may produce biased parameters. So, I ruthlessly hunted for homoscedasticity. Is my assumption about the parameters being biased correct? Overall, is the approach of mitigating as many as 17% of the observations in order to get an 'unbiased' estimate of a parameter correct? If not, why?
2. In practice, is it safe to remove 17% of the observations for making predictions? Because, as I understand, normal distribution of residuals is important for making predictions. As Gelman and Hill point out in "Data Analysis Using Regression and Multilevel/Hierarchical Models";
Normality of errors. The regression assumption that is generally least important is that the errors are normally distributed. In fact, for the purpose of estimating the regression line (as compared to predicting individual data points), the assumption of normality is barely important at all. Thus, in contrast to many regression textbooks, we do not recommend diagnostics of the normality of regression residuals. If the distribution of residuals is of interest, perhaps because of predictive goals, this should be distinguished from the distribution of the data, y
3. Should I instead employ other form of regression as has been proposed by @gung in his answer?
P.S. I know the assumptions pertaining to homoscedasticity and normality are regarding the 'errors' not the 'residuals'. However, the fact that the errors could not be known, I employed the term 'residuals' instead to avoid confusion. After all, the assumptions are tested for residuals in lieu of the actual 'errors', a fact that has been echoed in response to this question.
