If I am given a series of, let's say, 50 observations, of a continuous data, for example, the height of some group of people: 165.23 cm, 134.28 cm, and so on, and I want to find the box plot, I need to find the median. Should I do that with N/2 formula or the L+N/2−Fm−1fm⋅c formula? I have this doubt because they (normally) give different results. More generally, when should I use one or the other formula? Any help is appreciated :D
-
Different formulas are used by different software. The original method, as devised by John Tukey, is described at https://stats.stackexchange.com/a/286012/919. More details are given at https://stats.stackexchange.com/questions/134229. But about your title: where does "grouped data" come in? The text of your question seems to describe *individual* observations. – whuber Feb 18 '22 at 21:16
1 Answers
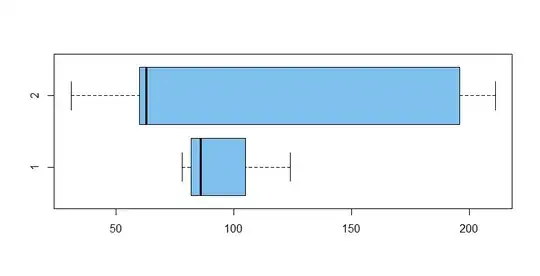
First, you should not try to make boxplots for very small samples. The absolute minimum should be $n = 5,$ otherwise the boxplots might not have fully-formed "boxes" and "whiskers." [Sampling and plotting in R statistical software.]
set.seed(12)
x1 = round(rnorm(4, 100, 15));  x1
[1]  78 124  86  86      # normal: population mean 100, SD 15
summary(x1)  # 'Five number summary' of 4 observations:
   Min. 1st Qu.  Median    Mean 3rd Qu.    Max.
   78.0    84.0    86.0    93.5    95.5   124.0

x2 = round(rexp(5, 1/50));  x2
[1] 196 211  63  31  60  # exponential: mean 50
summary(x2)
   Min. 1st Qu.  Median    Mean 3rd Qu.    Max.
   31.0    60.0    63.0   112.2   196.0   211.0

boxplot(x1, x2, horizontal = T, col="skyblue2")
Second, some software uses Tukey's original method of finding the median and the "fourths" (which are similar to quartiles) and others use various definitions of quartiles. Resulting differences are usually not noticeable unless samples are very small.
When you have enough data to get a nice boxplot, you may also see some outliers; it is important not to over-react to outliers. They are worth a second look, but only if they are provably wrong should you consider deleting them. (By provably wrong, I mean a verified data entry error, evidence of equipment malfunction, or something absurd like a negative height or a worker recorded as being 189 years old.)
set.seed(123)
x3 = rnorm(500, 100, 15)
summary(x3)
   Min. 1st Qu.  Median    Mean 3rd Qu.    Max.
  60.09   91.38  100.31  100.52  110.28  148.62

x4 = rexp(500, 1/50)
summary(x4)
    Min.  1st Qu.   Median     Mean  3rd Qu.     Max.
  0.0672  14.5321  36.3305  52.4090  70.9643 321.0942

hdr = "Samples of size 500 from NORM(100, 15) [bottom] and EXP(mean= 50)"
boxplot(x3, x4, horizontal = T, col="skyblue2", main=hdr)
Third, because there are no direct clues in a boxplot about the sample size, you should always show the sample size with the boxplot or in nearby text.
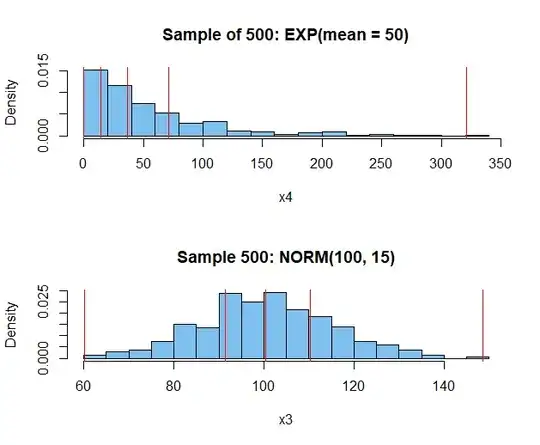
Histograms of samples x2 and x2 with sample quartiles
marked in red:
par(mfrow=c(2,1))
 hdr1 = "Sample of 500: EXP(mean = 50)"
 hist(x4, br=16, prob=T, col="skyblue2", main=hdr1)
  abline(v = quantile(x4), col="red")
 hdr2 = "Sample 500: NORM(100, 15)"
 hist(x3, br=16, prob=T, col="skyblue2", main=hdr2)
  abline(v = quantile(x3), col="red")
par(mfrow=c(2,1))
- 47,896
- 2
- 28
- 76


