Problem: I am looking for a metric to find the representativeness of a sample for a given distribution, being the representativeness of a random sample as the degree of capacity of the sample to exhibit the characteristics of a sample that would be obtained by a given distribution.
In my case, I am trying different methods that generate samples landing in a polyhedron, and I would like to measure how good are this methods on generating a set of samples that is representative of all the feasible space (i.e. the polyhedron), assuming that a perfect sample set would be the equivalent of a sample generated by a random variable with uniform distribution in the feasible space (i.e. the polyhedron).
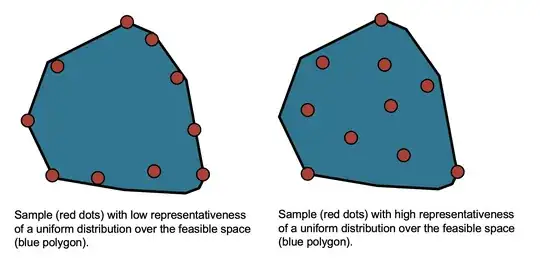
For instance, consider two different methods that generate samples sets as shown in the image below:

It could be said, by mere observation, that the method generating the samples of the figure in the left is not as representative as the second method, as it over-samples the borders and does not return samples from the interior of the polygon. However, how would you quantify it? What metric would you suggest. It is worth mentioning, in case it might help, that the real feasible space is a convex polyhedron of relatively high-dimensions (n~[10,100]).
Initial approach: My first intuition was to compute statistical moments (mean and variance) of the sample and the given distribution and compare them, although I found it too simplistic, and I am sure there is a better metric to compute it. But if so, how would you deal with multi-dimensional data. What is the best way to compare how apart are two covarience matrices?
Also, I had the idea to compute the likelihood of the different sample sets and compare them... only to realise that, as the probability distribution is uniform over the polyhedron, and all sample sets of the same size will have the same likelihood. However, it might exist a way to use the likelihood concept to quantify how different is a sample from a given distribution.
Any help, comment and/or suggestion is very much appreciated, thank you a lot in advance!