1

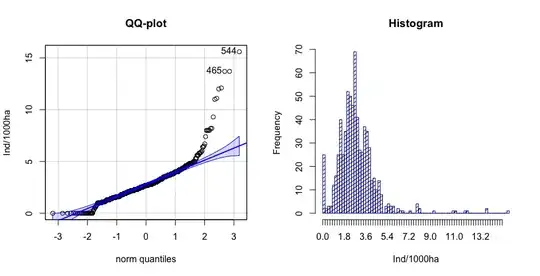
I am trying to analyze hunting harvest data with response-variable being individuals/1000 hectares and a series of explanatory variables to describe it. Response variable is continuous (fractionals), with a mean of 2.86. However, in some hunting areas, the annual harvest is zero, thus the variable includes many zeros. Ranging from 0 to 15.6 (N = 690). How do I go ahead to chose a proper probability distribution for this? I did a qqPlot (package 'Car') in R, and a simple histogram.

Further, what sort of model do you think would be most appropriate for this data? I've been thinking of GAMM's or GLMM's.

enter image description here

kjetil b halvorsen
  • 63,378
  • 26
  • 142
  • 467
Erik Berg
  • 11
  • 1
  • 2
    1. You have count data, so some count data regression model (possibly with zero inflation) could help. But, then you must not divide by area to get the rate, but use the count itself as esponse and the area (well, its log) as an *offset*. Search this site for this terms if they are unknown to you, they are discussed in many posts. 2. It is not the marginal distribution of the offset that is important, so histograms/qqplots of that will not help you. – kjetil b halvorsen Feb 14 '22 at 14:09

1 Answers1

0

As your primary observations are counts, you should use an analysis method that is designed for counts and thus models observations with 0 counts directly. A Poisson generalized linear model with log link is a standard way to start.

As Kjetil B Halvorsen said in a comment, you use an offset, log(area), in your regression to account for the area corresponding to each observation. Then you can interpret your results of modeling counts in the units of individuals/1000 hectares that you desire. See this page among many others on this site.

It's possible that a simple Poisson model won't be adequate, in that the equality between variance and mean for a Poisson distribution won't adequately describe your results. A "quasi-Poisson" model, in which confidence intervals are based on other-than-Poisson variance, or a negative binomial model could be next steps in that situation.

It's not clear from your description that a mixed model ("MM" in your abbreviations) would be needed here. Whether you need to consider a "generalized additive" ("GA") model has to do with whether simple functional forms of your covariates are adequate in the linear predictor of log(counts). I'd start with simple linear modeling of covariates in a Poisson generalized linear model, as if that works it's usually easier to explain to others.
EdM
  • 57,766
  • 7
  • 66
  • 187
  • You were right. A Poisson was adequat to decribe my results, instead i did to quasi-possion. However, since this does not give me any AIC, BIC etc. How to i go forward with model simplification? – Erik Berg Feb 15 '22 at 08:26
  • 1
    @ErikBerg Have a look at [this answer](https://stats.stackexchange.com/questions/333410/comparing-quasibinomial-glms-in-r/333908#333908) for more info on the use of AIC with quasi-likelihood models and [this answer](https://stats.stackexchange.com/a/20856/97671) for the careful balance required when performing model selection. – vkehayas Feb 15 '22 at 13:03
  • @ErikBerg if you need a true likelihood for AIC, consider a negative binomial model instead. The link in another comment illustrates the dangers in doing model selection/simplification solely on that type of basis. See Frank Harrell's [course notes](http://hbiostat.org/doc/rms.pdf) and [book](https://hbiostat.org/rms/) for principled ways to build (and simplify, if necessary) regression models of all types. – EdM Feb 15 '22 at 14:33