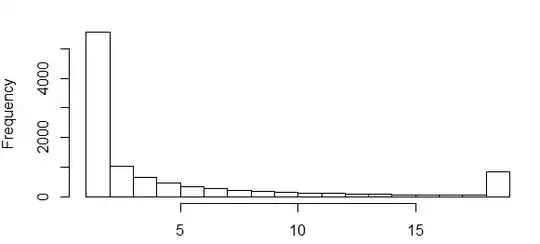
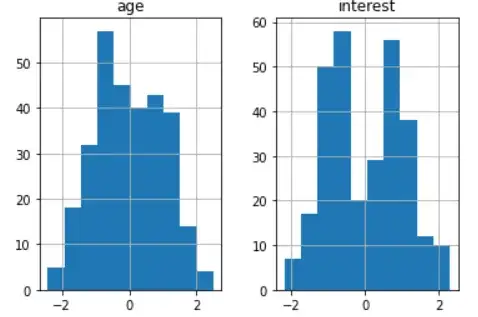
This is the original data histogram, I have a data set and plot by DataFrame.hist():
After that I applied the zscore function to my data set and plot this histogram:
After I have applied zscore, I applied standardscaler to my data set and plot this:
I have some questions:
- Why didn't my data distribution change?
- Why didn't the standard scaler work?
- Should I apply both a normalizing function and scaling function?


