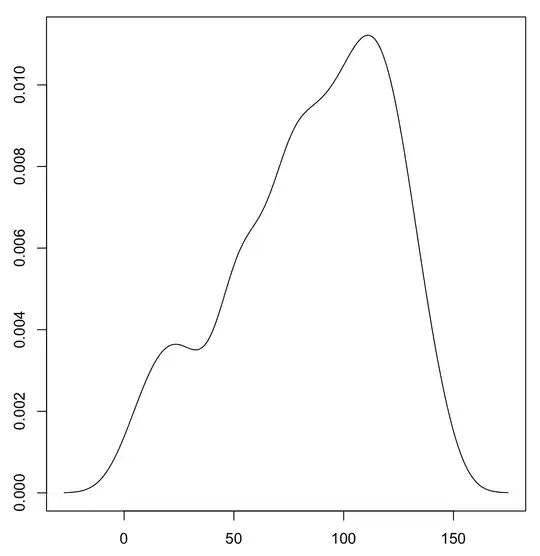
a) Draw a graph representing the above data. The graph should include the curves derived from the data, and all labels and legends as needed, and should be sufficiently accurate to enable you to identify the overall trend in system reliability and its four components.

Asked
Active
Viewed 10 times
0
kaka
- 11
- 2