I am currently working through the paper Estimation of Probability of Defaults (PD) for Low-Default Portfolios: An Actuarial Approach
In Section 2 of this paper, the author provides the following example data, which I have replicated in Excel.
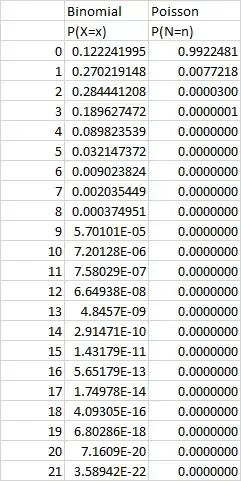
The author then proceeds to determine the probability mass functions of the binomial distribution and Poisson distributions respectively.
For example, for the risk grade BBB, this would be (I have calculated it in Excel), this would be
So far this covers everything up to Page 9. However, on Page 10, the author then shows the following table for Risk Grade BBB, which he mentions is obtained by convolution. I have no understanding of the concept of convolution, but I am trying to figure out how the author goes from the two PMFs (Binomial and Poisson) to obtain the table below. I am trying to replicate this process on my own, so as to try and understand the methodology to apply to a different problem that I am working on.
Can anyone please assist?


