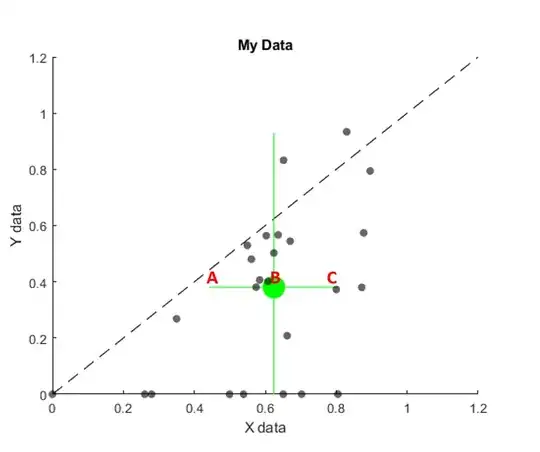
Below is a 2d scatter plot where the large green dot is the median of the data in x and y. My question is about whether there is a convention for showing the error on the median. As shown, each of the lines coming off of the median are a length of 1*IQR (in their respective dimension). i.e. the line segment marked AB = BC = 1*IQR and the line segment marked AC = 2*IQR. I'm wondering if this is the correct way of displaying this, or if instead it is more appropriate to make AB and BC equal to 0.5*IQR and AC equal to 1*IQR. Thanks!

Asked
Active
Viewed 21 times
0
Scott
- 1
- 1
-
What definition of "median" of a 2D dataset are you using? It seems like you are looking at the point of *univariate* medians, but then the product of interval estimates of those medians would be an overestimate of the uncertainty of that point. – whuber Dec 22 '21 at 21:06
-
Yes, I'm using univariate medians. I'd like to display the uncertainty in x and y independently – Scott Dec 22 '21 at 22:43
-
Okay. But have you noticed there are situations where this "point of medians" lies far from any of the points in the scatterplot? Here's a separate comment: the IQR does not directly reflect the uncertainty in the median. See https://stats.stackexchange.com/questions/45124 for some useful formulas. Is your question about the actual uncertainty or only about visualizing it? – whuber Dec 22 '21 at 22:57
-
Point taken. I think for my purposes I'm more interested in the univariate medians than finding a geometric median or something like that.... Thank you for pointing out that the IQR doesn't reflect uncertainty very well. I guess it makes more sense to display the SE of the medians as opposed to anything to do with IQR? As I understand it, perhaps the best way to approximate the SE is simply via bootstrapping? – Scott Dec 23 '21 at 09:03
-
The thread I linked to includes simple formulas for confidence limits. No bootstrapping is necessary--and it would produce essentially the same limits, anyway. Since you want to focus on visualizing the univariate medians, your problem seems to be reduced to the more familiar one of depicting (two) univariate datasets rather than a bivariate dataset. There are various conventional solutions, such as notched boxplots. – whuber Dec 23 '21 at 16:38