I need to understand how to read kernel density graphs. How do you come up with the values in y-axis?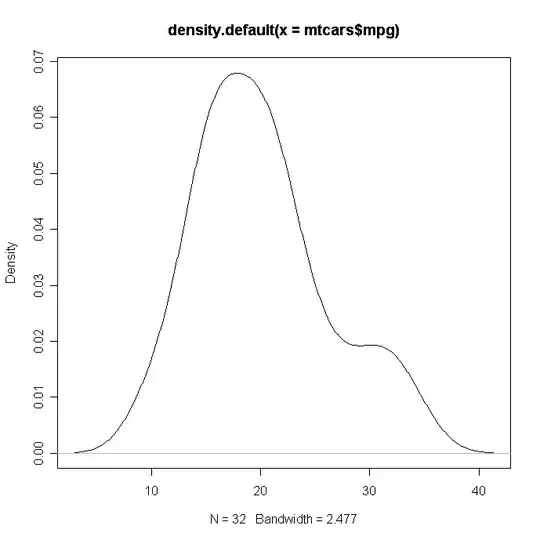
Asked
Active
Viewed 1.1k times
3
Danica
- 21,852
- 1
- 59
- 115
user1471980
- 685
- 3
- 11
- 21
-
Also closely related: http://stats.stackexchange.com/questions/4220/probability-distribution-value-exceeding-1-is-ok and http://stats.stackexchange.com/questions/14483/intuitive-explanation-for-density-of-transformed-variable. – whuber Apr 09 '13 at 17:39
1 Answers
3
The Y-axis in a kernal density estimate of the PDF of a random variable is interpreted as a probability differential, like in calculus. It's a unitless measurement but any mesaurable area under the curve can be interpreted as a probability estimate.
AdamO
- 52,330
- 5
- 104
- 209
-
2so given yaxis being 0.07, what does this mean in plain English. I understand histogram frequency charts, but this seems complicated to me. Can you clarify this little bit more? – user1471980 Apr 09 '13 at 17:18
-
The linked CV question from Huber should address your technical knowledge gap here. The literal interpretation of the Y-axis is a dimensionless quantity, like an infinitesimal grain of probability sand. An interpretation of a smoothed density estimate that's appropriate for applied audiences and scholarly journals is to calculate estimated "probability area" in pre-specified ranges. If the X-axis here were times to recurrence of cancer in months following therapy, you might be interested in risk of 1 year recurrence which you could estimate by using the function `integrate(...)`. – AdamO Apr 09 '13 at 21:26