0

I'm trying to determine how well an observed distribution matches a theoretical one graph of distributions
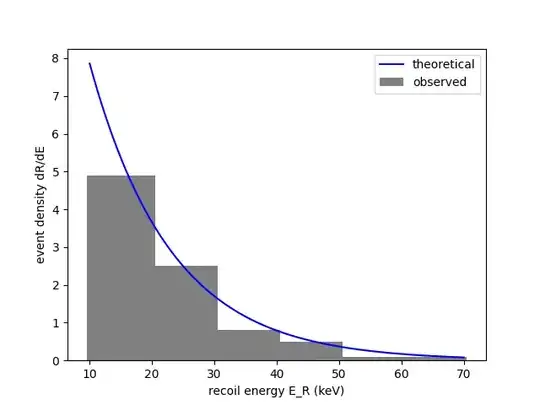
However, if I do a KS test as I've been taught on this, the highest difference (KS statistic) between the two distributions (at 10 keV) is rather high, so will give a fairly bad score, even though the distributions seem to match fairly well by eye. The KS statistic will also vary greatly with the bin width. Before I've only done KS tests on normal-type distributions which won't have this problem (at least as much). The same problem arises if you plot the cumulutive distribution.

I'm wondering if there's some way to overcome this high sensitivity at the bottom of an exponential distribution, or if there's some other test I should be using?

ACarter
  • 101
  • 1
  • 2
    [Formal distribution testing is less helpful than one might hope.](https://stats.stackexchange.com/questions/2492/is-normality-testing-essentially-useless) Every criticism of normality testing there applies to what you’re trying to do. What’s wrong with eyeballing the distribution fit? // Additionally, to test for an exponential distribution, you would have to do something about the fact that your data never fall below $10$. An exponential distribution has support on $(0,\infty)$, not $(10,\infty)$. – Dave Dec 06 '21 at 00:38
  • 1
    The Exponential distribution is continuous yet your data is binned. You may have better success with a Chi-sq test, comparing your bins with the expected bin count. (you will need to determine where to calculate the expected bin count, the left, center or right side of each bin) – Dave2e Dec 06 '21 at 02:02
  • I much prefer using the eyeball test when evaluating a model fit. Perhaps you could compare the exponential distribution with other parametric forms using AIC or the -2log likelihood statistic. If you fit a two-parameter model like gamma or Weibull and the shape (scale) parameter is not significantly different from 1 then this could be your argument for an exponential fit. You could stick with a two-parameter model to account for the possibility that the data generative process indeed requires a free shape (scale) parameter and your sample is simply too small to detect this. – Geoffrey Johnson Dec 06 '21 at 02:19
  • 1
    The KS test doesn't work as advertized on binned data. It assumes continuous variables and will be highly conservative if you treat the data as if it occurred at the bin-centers – Glen_b Dec 06 '21 at 04:02

0 Answers0