I'am interested to know the opinion on this matter.
I have Data of a Financial Security. The goal is to view the Standard Deviations levels of the data to possibly see patterns of behavior of the Financial Security
As Financial Market theory states when taking the distribution of the prices of a Financial Security, it is not Normally Distributed. So i than took the first difference to detrend the data. the detrended data displays a normal distribution.
I have charted the Detrended Data, with the Standard Deviation Levels. It seems to display what is expected , where for a Normally Distributed Data, when the data reaches the Standard Deviation levels, it would likely retrace towards the Mean Level areas. But two things came apparent to me,
Detrending data is almost like basically taking the percentage change into something. Except when Detrending and taking the first difference order, you don't divide the difference in change of the 2 data points by the initial data point.
I have noticed in some Financial Market analysis and articles, when the Standard Deviation Levels are mentioned and used, they are not detrending the data.
So My Questions are below,
1 ) It seems like if your Using Detrended Data, and wanted to view the Standard Deviation Levels as important targets of the data, it seems like this would only be good if you wanted to analyze the volatility or change of the data, but not good in analyzing the actual price levels of the data ? the reason i mention this is because some Financial Market analysis of Security prices are just plotting standard deviation levels of non-detrended data, which may imply that it is better for analyzing and predicting the price levels.
- If the Data of a Financial Security does not display a normal distribution, than would it be useless to rely on the Standard Deviation Levels as points of mean reversion ?
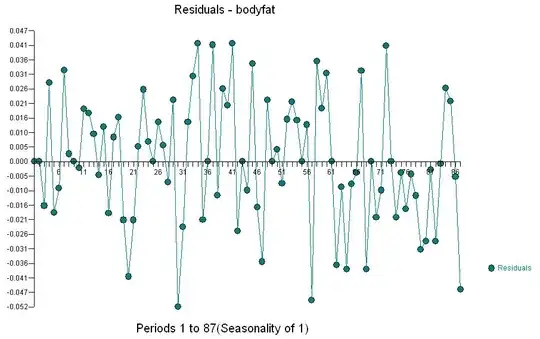
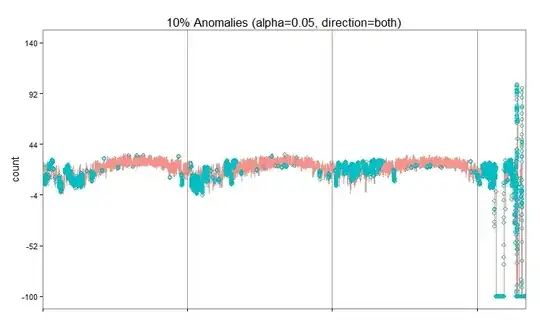
Below are the Charts of the Financial Security Data, one Non-Detrended, the other De-Trended,

