0

I have a problem where my dependent variable is given as a click-through rate and thus bounded [0,1]. While I have the traffic for each sample (a combination of design factors) and could reconstruct a dataset appropriate for logistic regression..is there a proper way to avoid doing this? From what I've seen it sounds like Quasi-binomial or Beta would work.

I'd prefer to do this in R, but the project requires Python which luckily has a lot of equivalents in the sm.statsmodels package. I thought that the standard GLM, Binomial w/ Logit link would not accept a continuous DV, but the model seems to output fine when given the freq_weights as additional argument. Is the code implicitly calling a Quasi-Binomial in the background?
enter image description here

kjetil b halvorsen
  • 63,378
  • 26
  • 142
  • 467
  • Hi, there are blind and visually impaired users of this site who interact with it using screen readers. The screen readers can't handle the equation in your screenshot. Please edit the post to include the equation as LaTeX. If it helps, we have some [resources on using LaTeX on Cross Validated](https://stats.meta.stackexchange.com/a/1605/155836). – kjetil b halvorsen Nov 18 '21 at 01:04
  • You could use a fractional response model, see https://stats.stackexchange.com/questions/216122/what-is-the-difference-between-logistic-regression-and-fractional-response-regre for details. – kjetil b halvorsen Nov 18 '21 at 01:08

2 Answers2

1

If you have the number of people who say the button (or who had the potential to click through) and your outcome is the number of people who actually clicked, then you can do a Poisson regression with an offset.

Poisson regression assumes the log of the expectation of $y$ can be expressed as

$$ \log(E(y)) = X\beta + \log(N) $$

Here, $\log(N)$ is an offset term. Some algebra can show this is equivalent to modelling $\log(E(y)/N)$, and since $y$ is a count then $y/N$ is a rate and $E(y)/N$ is the expected rate.

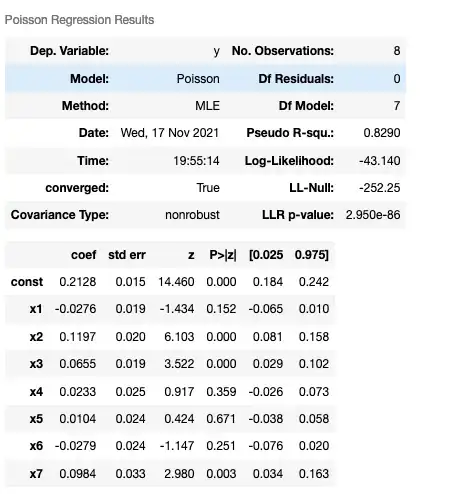
This is very straightforward to do in statsmodels. Just pass the log of the traffic to the offset argument

import pandas as pd
import numpy as np
from statsmodels.discrete.discrete_model import Poisson
import patsy
np.random.seed(0)

# Create data
color = pd.DataFrame({'color':['Blue','Green']})
shape = pd.DataFrame({'shape':['Round','Square']})
size = pd.DataFrame({'size':['Regular','Small']})
df = color.merge(shape, how='cross').merge(size, how='cross')
df['traffic'] = np.random.randint(low=1000, high=10_000, size = len(df))

X = np.asarray(patsy.dmatrix('~color*size*shape', data = df))
beta = np.random.normal(0, 0.05, size = len(X.T))
beta[0] = 0.2
lam = np.exp(X@beta + np.log(df.traffic))
df['y'] = np.random.poisson(lam)

# Model it

model = Poisson(df.y, X, offset=np.log(df.traffic)).fit()

model.summary()

enter image description here

You can verify that the estimates are close to their real values.

Demetri Pananos
  • 24,380
  • 1
  • 36
  • 94
0

Hmm if your variable is bounded [0,1] and represents a rate of some sort or a count (which given time can then become a rate) it might be more useful to use a glm with a Poisson link function and include an offset term.

Refer to for more: When to use an offset in a Poisson regression?