I have this algorithm that spits out a value between two objects. The smaller the value the more similar those objects are in euclidean space.
I ran it on hundreds of examples that are true positives, i.e. I know they are similar. I know their lower and upper values, the lowest is 0.01 and upper is 0.64. The theoretical upper and lower limits are 4.0 and 0.00 respectively.
Can I use those results, which are given below, as a measure of confidence if I give it two objects that It has not seen.
Example;
I give it hundreds of examples of a car. The values for car are from 0.01 to 0.45. Next, I give it a Horse cart and a car to find distance between. It gives me a value of 0.6, so I reject it, cause I know from examples that for any value higher than 0.45 is rejected. 0.45 is my threshold.
What I want to find is a confidence in my values lower than threshold.
Something like -->
0.45 ------> confidence 50%
0.30 ------> confidence 70%
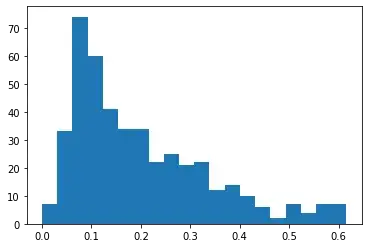
What i tried was to plot a histogram of the values from 448 samples. And now I am stuck.
NOTE: I am a newbie and know just the basics, like mean, var, std and some probability distributions. Any help would be appreciated. Cheers.
Here's how the values look like.

