4

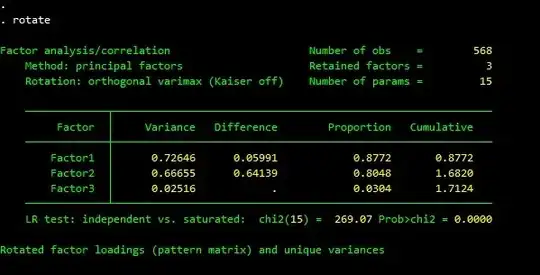
I'm using Stata's exploratory factor analysis command ("factor"). When I ask for a rotated solution (using the varimax orthogonal method, which is the default) it gives me (aside from the loadings etc) a value called "proportion" for each factor (with the first factor having the highest value). Although Stata's documentation doesn't seem to ever say so explicitly I assume that "proportion" represents the proportion of the total variance in the observed variable explained by each latent factor. However, when I view a rotated solution the total "proportion" values often add up to more than 1, implying that the factors in total explain more than 100% of the variance in the observed variables, which seems nonsensical. This can be seen in Stata's example dataset for "factor"

If in stata you type:

"webuse bg2

factor bg2cost1 bg2cost2 bg2cost3 bg2cost4 bg2cost5 bg2cost6

rotate"

you will see that the "proportion" values for the 3 retained factors add up to 1.7124.

enter image description here

So what's going on here? Obviously I'm confused about what "proportion" means, but Stata's documentation doesn't seem to provide any guidance on how I should interpret this value. Also, how can I correctly characterize the explanatory power of rotated factors? I would like to be able to say that my first factor explains X% of the variance while the second factor explains Y%, but is that even possible with rotated solutions?
Graham Wright
  • 1,559
  • 1
  • 11
  • The best way is to publish some example data (or use some model dataset, such as Iris) and show the results that rise your concern. – ttnphns Nov 05 '21 at 12:41
  • I'm using Stata's own example dataset and have included a picture of the results in question as well as code that anyone with Stata can use to replicate these exact results. Is there something else you think I should include? – Graham Wright Nov 05 '21 at 16:58
  • 1
    That doesn't let anyone without Stata replicate it though. Stata is weird though, see this question: https://stats.stackexchange.com/questions/154378/very-different-results-of-principal-component-analysis-in-spss-and-stata-after-r – Jeremy Miles Nov 05 '21 at 17:02
  • I think Jeremy has linked you to the right thread – ttnphns Nov 05 '21 at 17:17
  • I don't have access to any other programs that do factor analysis and I'm not sure what Iris is. I assume that my problem is that I'm just misinterpreting what Stata is telling me and wanted to know if someone who uses Stata can set me right. Are you saying you want me to construct a new dataset of made up data and post that in the question itself? – Graham Wright Nov 05 '21 at 17:56
  • 1
    If you're looking specifically for Stata help, you might be better off on statalist - there are not as many stata users on CrossValidated. – Jeremy Miles Nov 05 '21 at 18:48
  • Search Stata resources. For example https://www.statalist.org/forums/forum/general-stata-discussion/general/1553907-principal-factor-factor-pf-what-if-the-proportion-of-variance-accounted-for-by-the-factors-is-greater-than-1-00-greater-than-100 – ttnphns Nov 05 '21 at 18:49
  • A variant of this was posted at https://www.statalist.org/forums/forum/general-stata-discussion/general/1635049-after-varimax-rotation-stata-says-factors-explain-more-than-100-of-the-variance It's always a good idea to tell people about cross-posting. – Nick Cox Nov 07 '21 at 14:59

0 Answers0