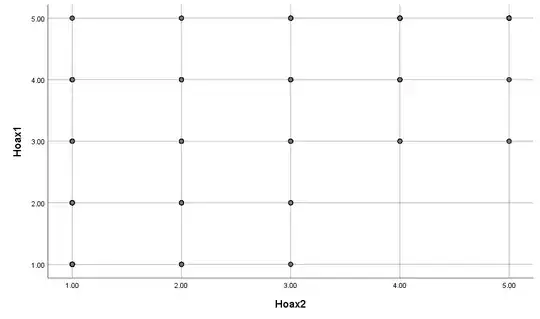
I was wondering whether these 2 variables are correlated. According to the analysis, the correlation is 0.89, which is expected, as they are items of the same scale. But I'm having trouble with interpreting this scatter plot.
Asked
Active
Viewed 20 times
0
-
I recommend you consider the marginal and joint distributions of these variables more closely. – DifferentialPleiometry Oct 29 '21 at 02:04
-
1Is there a way to plot the point size according to how many points are on top of each other? – Dave Oct 29 '21 at 02:10
-
Use the point size or showing points as bins reflecting the number of points sharing the same coordinates, or use jittering. – ttnphns Oct 29 '21 at 03:51
