I have multiple samples which include a response time of a system. I want to test if no sample is significantly different (primarily the expected value). For two sample testing I'm using the sign test and for testing multiple ones at a time I'm using the Friedman test.
Unfortunately, the samples have non-independent noise (verified with Hoeffding's test, p-value < 1e-8). In practice that means that for samples with over 10000 observations, the sign test and Friedman test show statistically significant differences (p-value < 1e-6) for samples that were measurements of exactly the same input.
What is the recommended practice for dealing with with non-independent, non-uniform, multimodal, heteroskedastic noise for repeated measurements data?
Data acquisition
The measurements are performed as follows:
- First create a list of randomly ordered tuples of tests to perform (e.g., given three inputs, A, B, and C, it could be something like ABC, CBA, CAB, BCA, etc.)
- Run the tests in that random order (e.g. send input A, wait for reply, send B, wait for reply, send C, wait for reply, send C, wait for reply, send B, wait for reply, etc.)
- The inputs are sent by a Python application over a regular TCP connection, the "protocol" is just connect, send query, wait for response, close connection
- Have a system running in the background that monitors the communication, noting the time between query and response, saves that as a list (continuing the example: 68028 ns, 69667 ns, 67971 ns, 68535 ns, 69458 ns, 67767 ns, 68335 ns, ...)
- This is done by
tcpdump
- This is done by
- Combine the knowledge of the ordering of the tests to the noted times to get measurements for specific tests (continuing the example, for A I then get 68028 ns, 67767 ns, 67822 ns, ..., for B I get 69667 ns, 69458 ns, 68314 ns, ..., and for C I get 67971 ns, 68535 ns, 68335 ns, ...)
Data example
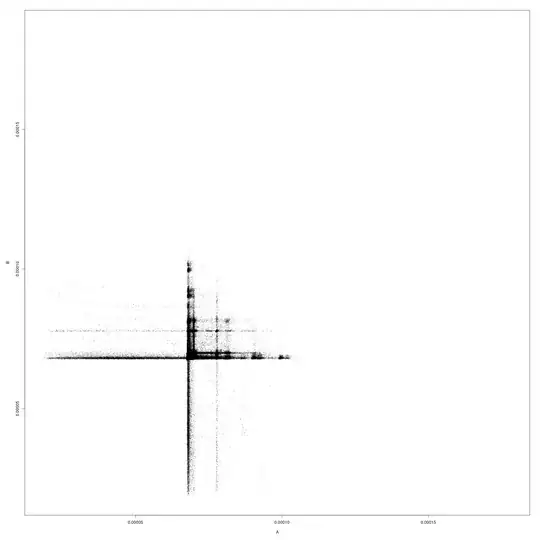
Example scatter plot of a pair of samples (axes are in
seconds):


