I am trying to fit a generalized additive model to the sum of events occurring over a fixed interval (count data >= 1). I would like to model these data as a function of day-of-year and include numerical + factor covariates to determine if these covariates have significant influence over the count outcome. There are about 3200 counts over 4 years collected from 4 sites.
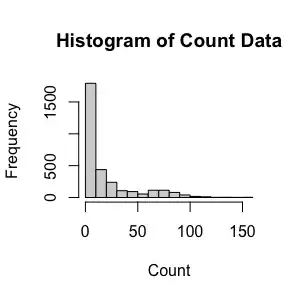
I am using R and the mgcv package for generalized additive modelling but seem to be stumbling over a few issues with this modelling simultaneously; I don't have much experience using GAMs. Here is a look at the distribution of the data:
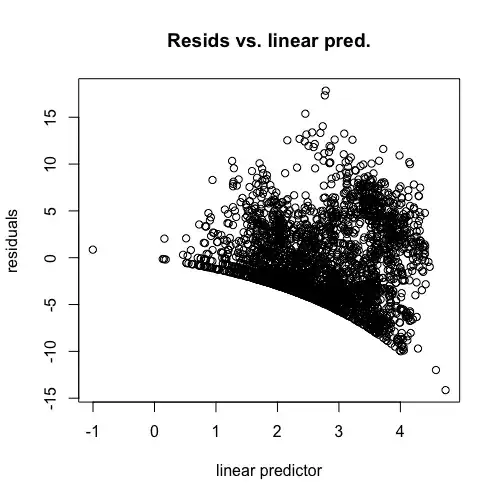
Firstly, in selecting the appropriate error distribution. I has long been my understanding that it is better practice to select distributions and test that adequately represent your data, rather than transforming your data if you have the option. So, I started with the gamma distribution with an identity link function. This fails to converge properly to the data. Furthermore, reading posts including this one here on SE, it seems that this distribution was a poor choice to begin with. As you can see from Figure 1, my data do not contain any 0 counts and comprises integer values, so I skipped over quasi- and zero-inflated distributions. I considered the Poisson and log-link. The model converges, however for each of the terms I have included, the k-index is below 1. Also, the diagnostics plots inspire fear and confusion:
After some more reading I gather that this high-density arcing shape in the residuals vs linear predictors plot relates to the high frequency of 1s and 2s in the count data and the model's superior ability to predict these outcomes compared to the higher count outcomes. I am now considering writing a new family function for the Poisson-inverse Gaussian distribution for heavy-tailed count data but can't pinpoint what exactly the problem was with the other distributions I've tried, and so have no reason to expect this to yield a better outcome.
Also, at each of these steps, I have tried increasing the number of basis functions for each smooth. This barely improve the k-indices, even as the number of basis functions approaches 1/2 the size of the data (tried up to 48 for main effects and up to 36 for interactions). That also takes a prohibitively long time on my machine. Here is a look at the code for constructing the model used in the last run:
gam(Count ~ s(Julian_Date,k=8) + s(continuous_var1,k=8) +
                  s(integer_var1,k=8) + ti(continuous_var1,
                integer_var1,k=c(8,8)),
                data = Count_Data, method = "REML",
                family = poisson(link="log"))
In summary, there are a few problems with the model I am trying to build for these data but I am struggling to understand the source of the problem, let alone how to solve it. Any ideas/suggestions/useful resources would be very much appreciated.


