It's simpler to compute the distribution function
$$F_Z(b) = \Pr(Z \le b)$$
and then differentiate it, because (except where this function has cusps),
$$f_Z(b) = F_Z^\prime(b).$$
The level sets $Z=b$ are lines with slope $-1.$ Five of them are shown in this raster plot of $Z$ in a situation where $a\lt 2.$
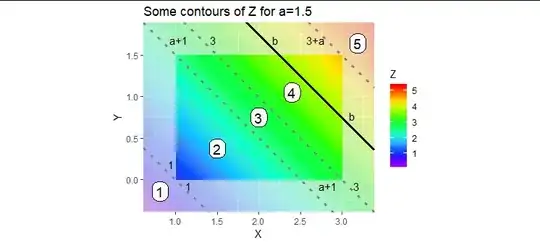
The solid line is the level set $Z=b$ (where $b$ is approximately $3.75,$ to illustrate). The region $Z\le b$ lies in the rectangle $[1,3]\times[0,a]$ (shown in bright colors) to the left and below the level set. Because the distribution of $(X,Y)$ is uniform,
$F_Z(b)$ is the relative area of the rectangle below and to the left of the line $X+Y=b.$
The dotted lines are special: they divide the plane into five regions, here numbered "1" through "5." The area below and to the left of the solid line in the figure consists of the part of region 2 in the rectangle--evidently the blue triangle; the part of region 3 in the rectangle--evidently the green parallelogram; and that portion of region 4 in the rectangle but below and to the left of the solid line--a green trapezoid. Therefore, $F_Z(b)$ in this example is the sum of those three areas, all divided by the area of the rectangle (equal to $2a$).
Use the area formulas of Euclidean geometry to finish the computation.
The picture when $a \gt 2$ looks a little bit different, so you might want to work that out separately.
There is a simplification.
It is geometrically obvious that the rate at which the area changes as $b$ is increased is proportional to the length of the level curve through $b$ lying in the rectangle. (It is straightforward to show this rigorously using the definition of the derivative.) The picture reveals that
As $b$ increases from $1$ to $a+1,$ the derivative increases in proportion to $b:$ it is linear.
As $b$ increases between $a$ and $3,$ the derivative remains constant.
As $b$ increases from $3$ to $3+a,$ the derivative decreases linearly, reaching $0$ when $b=3+a$.
Thus, the graph of $f_Z$ must have a trapezoidal shape between $b=1$ and $b=3+a.$
This observation determines $f_Z$ because that trapezoid must have unit area. To graph it accurately, draw any version of this trapezoid, compute its area $A$, then scale it in the $Y$ direction by a factor of $1/A.$
Here is the result for $a=3/2:$
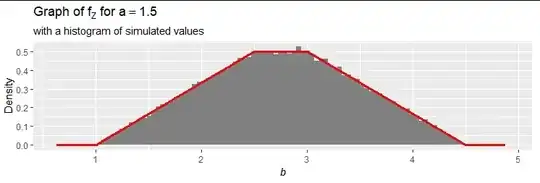
The calculation is supported by a simulation of 100,000 values of $Z,$ shown in the histogram.


