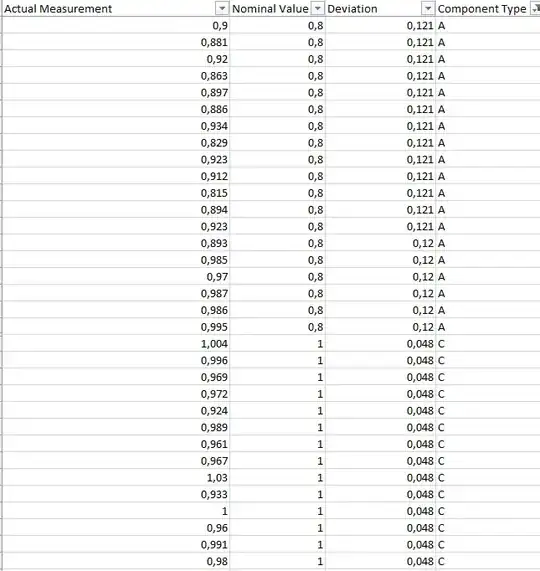
I have a dataset with measurements and their deviations from nominal value. These measurements have been made on 3 different categories of a component. The components differ in physical properties (size, weight, volume etc.) Below are some more details:
- 3 categories: A,B,C
- Count of number of observations for each category: $n_A$ = 2025, $n_B$ = 13507,$n_C$ = 21511
- Each component has it’s own nominal value : 0.8, 0.6, 1.00 respectively
- The measurements & deviations can be between -${\infty}$ & +${\infty}$
- The simple means of the measurements : $\overline{x}_A$ = 0.976, $\overline{x}_B$ =0.908 , $\overline{x}_C$ =0.806
- The standard deviation of the measurements : $\sigma_A$ = 0.062, $\sigma_B$ =0.069, $\sigma_C$ = 0.062
- The simple means of the deviations from nominal value : $\overline{d}_A$ = 0.062, $\overline{d}_B$ = 0.035, $\overline{d}_C$ = -0.024
- The data for each of the categories is close to normal (visual inspection using normal qq plot)
- I have performed Bartlett's test for homogeneity of variances. There are significant differences between the sample variances.
The aim is to find a single statistic which can be used as a single representative value for the variances of the 3 categories. In the sense that if tomorrow the this single statistic increases (or decreases) then it can be used an indication to investigate further for the causes of variation.
I have gone through several questions on Cross Validated related to the topic of pooled variance and this one, I believe, is very close to the question I am asking. However, I am not sure if the formula given in the answer can be applied to my case. If not, then which statistic can I use in this case? If yes, then are there any assumptions that I should check for violation before applying the formula?
I cannot post the entire data, but I have attached a screenshot of a proportion of the data to give you an idea of what it looks like.