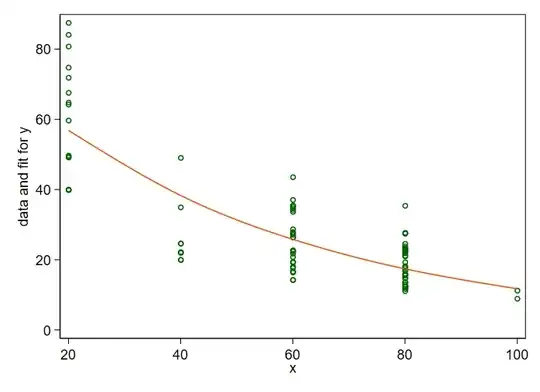
I have a simple model.
y ~ x
y is continuous (habitat gained per million $)
x is continuous (percent completeness of database used to generate y)
However, the residuals aren't normal.
Using the lowest absolute AIC I have determined that the best transformation for my dependent variable comes from using Box-Cox. Lambda = -0.22.
How would I report the results after putting this through a Pearson's Correlation and linear model in R?
Transformed - surely meaningless to the reader.
Or
Back-transformed - if so how?
i.e.
Transformed
Increasing x significantly decreased y (where y is transformed using a Box-Cox transformation where lambda = -0.14, r(968) = -0.76, 95% Ci [-0.78 -0.72], p = <0.001, intercept = 3.23, slope = -0.011)
Back-transformed
Increasing x significantly decreased y (where y is back-transformed from a Box-Cox transformation where lambda = -0.14, r(968) = -0.76, 95% Ci [1.86 2.21], p = <0.001, intercept = 75.01, slope = 0.99)
Data
dput(cv_dat)
structure(list(x = c(60, 80, 80, 80, 80, 80, 60, 40, 80, 40,
60, 60, 80, 80, 20, 80, 60, 60, 80, 80, 80, 80, 40, 60, 80, 20,
80, 80, 80, 20, 80, 20, 60, 40, 60, 40, 80, 60, 80, 20, 80, 80,
20, 80, 40, 80, 60, 20, 20, 100, 60, 80, 60, 80, 80, 80, 80,
60, 20, 60, 60, 60, 60, 60, 20, 60, 20, 60, 60, 80, 40, 80, 100,
60, 60, 80, 80, 20, 20, 20, 80, 40, 80, 80, 60, 60, 40, 40, 100,
80, 80, 20, 40, 80, 60, 80, 60, 80, 20, 40), y = c(34.7147333333333,
22.2961111111111, 20.9838761904762, 13.6910047619048, 23.83764,
12.3437625, 26.4331555555556, NA, 27.4610266666667, 24.6421583333333,
16.6102944444444, 26.4134, 22.8710666666667, 21.1918380952381,
49.4057666666667, 23.3209333333333, 34.2554666666667, 35.2223555555556,
22.4638666666667, 15.8720333333333, 11.7405725490196, NA, NA,
14.2798428571429, 13.6565571428571, NA, 17.0589133333333, 11.7647058823529,
23.1394444444444, 84.1246, 12.5, 71.8905666666667, 21.8039416666667,
20, 14.2517523809524, 49.0612888888889, NA, 28.73436, 12.4514833333333,
49.7169333333333, 11.1078740740741, 16.8650545454545, 67.6015666666667,
14.7961179487179, 20, 27.6441166666667, 33.6938666666667, 39.88104,
87.5281333333333, NA, 27.5380444444444, 19.3335833333333, 37.0873777777778,
21.8931333333333, 17.6113733333333, 17.9914533333333, 27.6807333333333,
22.4254333333333, 59.7117111111111, 19.4141066666667, 27.9112111111111,
16.6534333333333, 18.0147090909091, 16.4096555555556, 80.8001333333333,
27.1562444444444, 64.2548666666667, 19.2395933333333, 22.64985,
12.9968488888889, 22.2222222222222, 22.8283444444444, 8.93967575757576,
35.4892, 17.6795575757576, 35.4194666666667, 18.2141111111111,
40, 74.7947, 40, 12.2866375, 22.036637037037, 15.5196944444444,
15.7524333333333, 43.5638666666667, 22.704825, NA, 22.0478444444444,
11.236775, 14.7893846153846, NA, 64.8276, 24.675475, 15.9975151515152,
35.4629333333333, 12.4224458333333, 20.8199555555556, 24.5840666666667,
49.1685333333333, 34.9769333333333)), row.names = c(NA, -100L
), class = c("tbl_df", "tbl", "data.frame"))
Code
library(MASS)
library(dplyr)
library(bimixt)
library(broom)
library(ggplot)

cv_dat <- dat2 %>%
  rename(x = percent, y = roi) %>%
  sample_n(100) %>%
  dput()

dput(cv_dat)

plot(y ~ x, cv_dat)

bc <- MASS::boxcox(y ~ x,
                   data = cv_dat)
(lambda <- bc$x[which.max(bc$y)])

model_bc <- lm(((y^lambda-1)/lambda) ~ x, cv_dat)


# intercept and slope
model_bc$coefficients
# Back-transformed intercept and slope
boxcox.inv(model_bc$coefficients, lambda)

# pearson's
res <- cor.test(cv_dat$x, (cv_dat$y^lambda-1)/lambda,
                method = "pearson")

# 95% confidence intervals
res$conf.int
# Back-transformed 95% confidence intervals
boxcox.inv(res$conf.int, lambda)

cv_dat_aug <- augment(model_bc, newdata = cv_dat, interval = "prediction") %>%
  mutate(.fitted_trans = boxcox.inv(.fitted, lambda),
         .lower_trans = boxcox.inv(.lower, lambda),
         .upper_trans = boxcox.inv(.upper, lambda))

ggplot(cv_dat_aug, mapping = aes(x = x, y = (y^lambda-1)/lambda)) +
  geom_point() +
  geom_line(mapping = aes(y = .fitted)) +
  geom_ribbon(aes(ymin = .lower, ymax = .upper), col = NA, alpha = 0.3) +
  scale_x_continuous(breaks = seq(10, 100, by = 10)) +
  ylab("y_boxcox") +
  xlab("x")
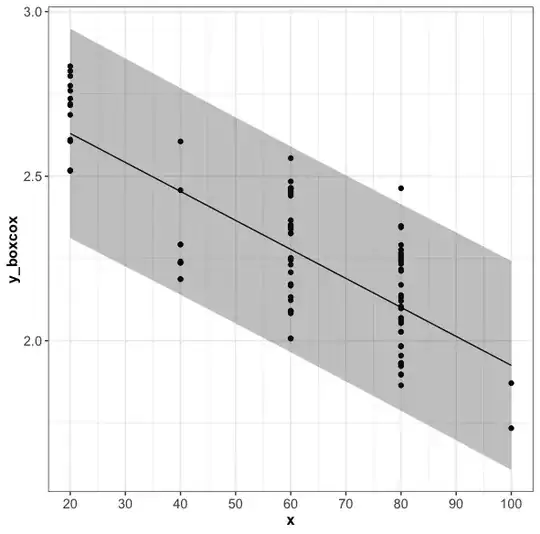
Box-Cox transformed y and fitted line

