I want to characterize the simple algorithm for selecting, say, 20% of a discrete set when the total size of the set is not known:
foreach item in the set
   generate a random non-negative integer R
   if (R mod 100) < 20 then
      select item
Does that algorithm have a name? Is it the same as Algorithm $B\mathcal U$ in Binomial random variate generation? (The algorithm there has "generate $u \sim \mathcal U(0,1)$" instead of a random integer, and uses $\le$ instead of $\lt$. Algorithm cited here)
The probability of ending up with $k$ items after examining $n$ of them can be calculated using the binomial distribution as: $$f(n, k) = \binom{n}{k}p^k(1-p)^{n-k}$$ where $p=\frac{20}{100} = 0.2\quad$ in this example. However, plotting the resulting values for widely different $n$ results in non-comparable graphs. In the picture below, I plotted the values of $f(n,k)$, scaling the interval $[0, n]$ in abscissa to the unit interval $[0, 1]$, and multiplying $f(n, k)$ by $n/10$ in ordinate, so as to compensate for shrinking the abscissa. (That way, the "integral" of the curve appears to be preserved.) For high values of $n$ I compute the average of a few $k$'s. Since the results are rather high, I use a logarithmic scale.
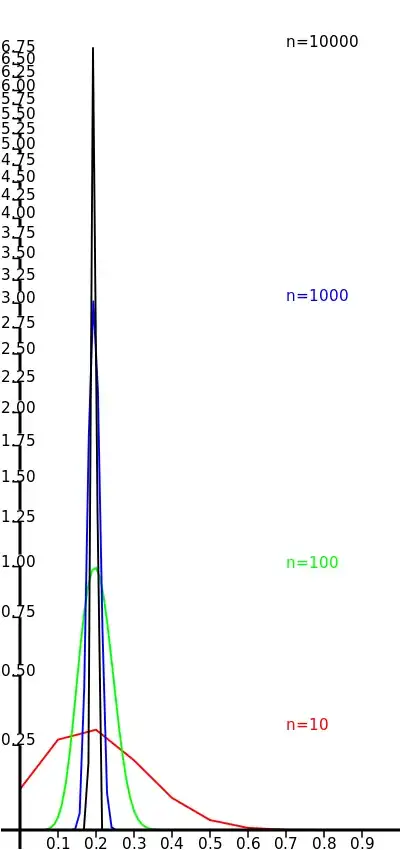
I'd like to show the picture above in a wikipedia article. However, the explanation above smells of original research. Is there an accepted way to scale those functions so as to compare them? Are there references that justify them?
Note: cross posted to math.stackexchange, I didn't know of this site.