1

I have a data set that has as DV the preference of spatial reproduced audio files (OLE) and as IVs the preference of only their content and the sensation of envelopment. All the variables are continuous. The aim is to predict OLE based on the 2 dependent variables. I fit a linear regression model (all assumptions are met) and I got R2=0.631 (both DVs are statistically significant). However, I observed that when my DV is lower than 0.55 (all variables are normalized, so a value of 0.5 corresponds to a neutral state) the model overestimates, while when DV is greater than 0.55 it underestimates (See the Graph) enter image description here
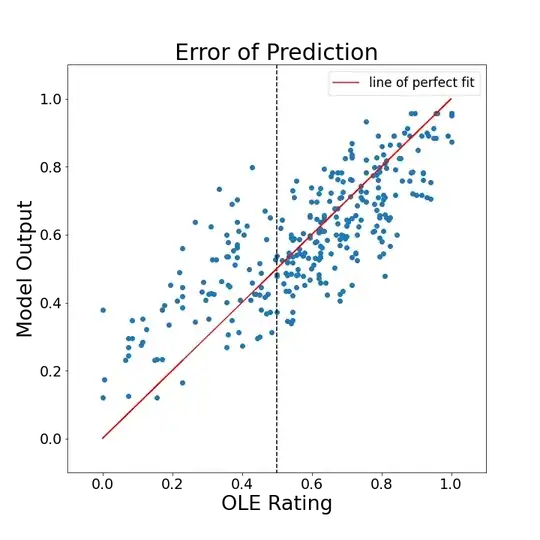
So a first thought is that the 2 dependent variables may have different weights in each subpart of the DV (one for values of OLE less than 0.55 and one for values greater than 0.55). I created a dummy variable HighOle which gets values 1 if the DV is greater than 0.55 and zero if it is less and I multiplied this dummy with both my IVs, in order to see the impact of each variable in each subpart of the data. In the model of course I included and the original variables, so I got: Model Description
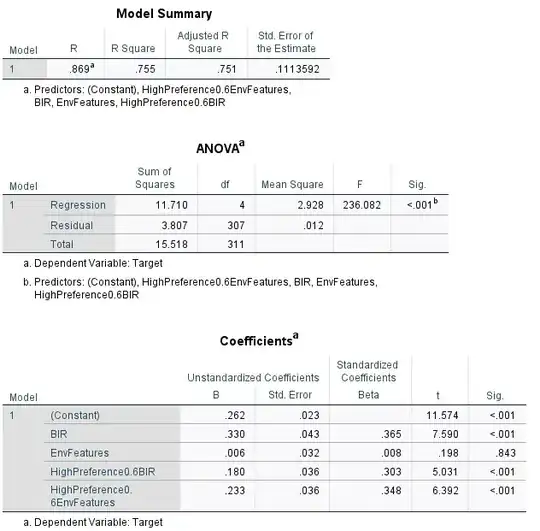
EnvFeatures: sensation of envelopment BIR: the preference of the content

I don't want to create a generalizable model which will predict new data, but to get an interpretation of the way people assess their preference on spatial audio systems and which factors take under consideration when they like or dislike something.

The question is if this methodology is correct because I can't find something similar on the Internet (it is like a piecewise linear regression with the only difference being that the segmentation is done in the dependent variable).

Apprentice
  • 642
  • 1
  • 24
GM MG
  • 31
  • 1

1 Answers1

1

This doesn't sound right. To predict a rating over 0.55 you would need to know first that it is above 0.55; do you see the circular reasoning there? Even if the model is not going to be used for making predictions, it doesn't make sense from a logical standpoint.

If you have good reason to believe that there are two clusters in your data that differ in their underlying linear regression models, you could model this using a cluster-wise regression model. From your description, however, it seems that you don't assume such clusters, but rather you observe that the model under-performs for a fraction of data. A guess can be made that there is some additional, unobserved confounder that would explain the difference. If you didn't observe it, not much can be made in terms of interpretability. You could use something like cluster-wise regression and say "there are two clusters", but this rather generates a hypothesis than explains the result.

Nick Cox
  • 48,377
  • 8
  • 110
  • 156
Tim
  • 108,699
  • 20
  • 212
  • 390
  • Thank you for your response !! I am aware of this circular reasoning, but the value of 0.5 in this case has a psysical meaning. Taking this under consideration, I split the data in two sub-datasets. One with OLE values less than 0.55 and one with OLE values less than 0.55. Fitting two separate regression models gives me exact the same coefficients with the combined model described above, with the only difference that I had to include the variable HighPreference0.6, which corresponds to the constant of the second separate model (this implemented for the high values). – GM MG Sep 01 '21 at 09:06
  • @GMMG but still, it is circular. Simplifying it: to predict that the value is high, you need to know in advance that it is high. – Tim Sep 01 '21 at 11:54